
Homework Answers


Add Answer to:
Question 2 3 pts The boxplots below show the distribution of test scores for two classes....
The boxplots below show the distribution of test scores for two classes. Class A Class B...
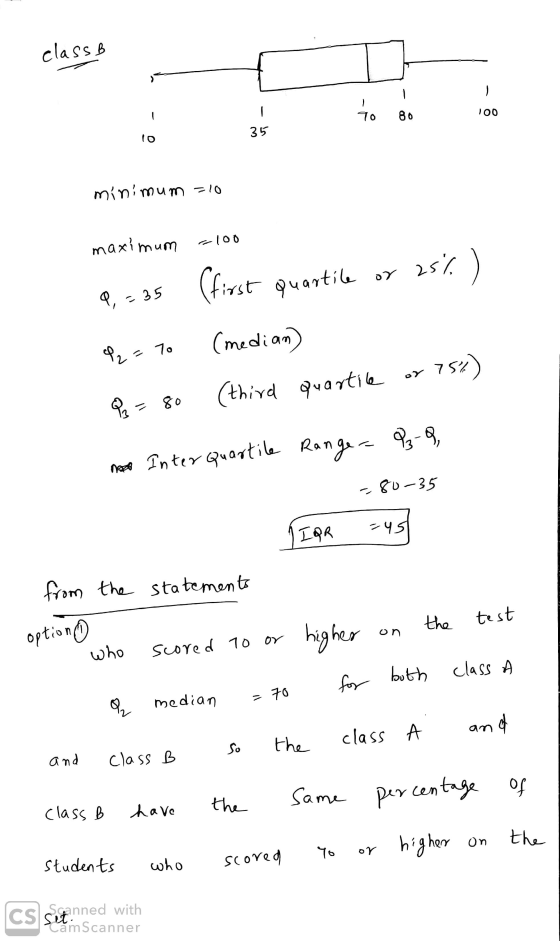
 The boxplots below show the distribution of test scores for two classes. Class A Class B 0 80 90 100 10 20 30 40 50 60 70 Test scores Which of the following statements is a valid conclusion that can be drawn from the boxplots? Choose all that apply. At least 25% of each class earned a B (80 or higher on the exam). Class B has more students than class A. Class A and B have approximately the same...
uiz Instructions Question 5 The following boxplots show test scores for a first exam given in...
 uiz Instructions Question 5 The following boxplots show test scores for a first exam given in two different classes. Grades 100 90 80 70 60 class 1 class2 Variable Which class had the largest IQR? ® class 2 O class 1 Previous
The graph illustrates the distribution of test scores taken by College Algebra students. The maximum possible...
 The graph illustrates the distribution of test scores taken by College Algebra students. The maximum possible score on the test was 140, while the mean score was 75 and the standard deviation was 15. 30 45 105 120 60 75 90 Distribution of Test Scores Using the Empirical Rule, What is the approximate percentage of students who scored between 45 and 105 on the test? % What is the approximate percentage of students who scored higher than 105 on the...
The graph illustrates the distribution of test scores taken by College Algebra students. The maximum possible...
 The graph illustrates the distribution of test scores taken by
College Algebra students. The maximum possible score on the test
was 130, while the mean score was 77 and the standard deviation was
13. 38 51 64 77 90 103 116 Distribution of Test Scores What is the
approximate percentage of students who scored higher than 103 on
the test? % What is the approximate percentage of students who
scored between 64 and 77? % What is the approximate percentage...
The graph illustrates the distribution of test scores taken by
College Algebra students. The maximum possible score on the test
was 130, while the mean score was 77 and the standard deviation was
13. 38 51 64 77 90 103 116 Distribution of Test Scores What is the
approximate percentage of students who scored higher than 103 on
the test? % What is the approximate percentage of students who
scored between 64 and 77? % What is the approximate percentage...
Can someone help with the last part? Not sure I understand it The boxplots below are...
 Can someone help with the last part? Not sure I understand
it
The boxplots below are for test scores from two sections (A and B) of the same course. Boxplot of Exam Scores for Class A and Class B Class 70 Exam Scores 50 60 80 90 100 a) Which section has the highest median score? The medians are the same b)Using the IQR as your measure, which section has the most spread in scores? The IQRs are the same...
Can someone help with the last part? Not sure I understand
it
The boxplots below are for test scores from two sections (A and B) of the same course. Boxplot of Exam Scores for Class A and Class B Class 70 Exam Scores 50 60 80 90 100 a) Which section has the highest median score? The medians are the same b)Using the IQR as your measure, which section has the most spread in scores? The IQRs are the same...
Consider the following scatterplot, regression equation, and correlation of midterm and final exam scores for a...
 Consider the following scatterplot, regression equation, and correlation of midterm and final exam scores for a class of 15 students. Which of the following are true statements? Select one answer ı points Y ะ 90.6-0.489x , r -0.602 110 100 90 80 , 5어 2 20 40 60 80 100 Mdterm Exam Score I. The same number of students scored 100 on the midterm exam as scored 100 on the final exam. II. Students who scored higher on the midterm...
The two Stem-and-Leaf plots below are data set for two searate exams, let's call them Exam...
 The two Stem-and-Leaf plots below are data set for two searate exams, let's call them Exam scores, and then cam 2 scores. These are fictional exam scores) Exam 2 3 29 4 568 51689 6 357 7 229 679 7 1 3 5 7 80245677 9 038 907 (a) Calculate the mean and the Five Number Summary for these two distributions. (Round to I decimal place if necessary.) Exam 1: Exam 2: Min Qi Median Q3 Max Min 01 Median...
if statistics test scores were normally distributed with a mean of 81 and a standard deviation...
if statistics test scores were normally distributed with a mean of 81 and a standard deviation of 4, a) what is the probability that a randomly selected student scored less than 70? b) what percentage of students had a B on the exam? c) the top 10% of the class had what grades?
μ = 84 σ = 5.1 n = 42 Questions: i. You scored a 91, what...
μ = 84 σ = 5.1 n = 42 Questions: i. You scored a 91, what percentage of the students did you score higher than and what is your z-score? ii. What is the score range of 68% of the class? iii. How many students (round up) scored less than 70% on the exam? iv. How many students (round up) earned an A (90%+)? v. How many students scored a B (> 80% and < 90%)?
cores on a 100-point final exam administered to all applied calculus classes at a large university...
cores on a 100-point final exam administered to all applied calculus classes at a large university are normally distributed with a mean of 72.3 and a standard deviation of 6.9. (a) What percentage of students taking the test had scores between 60 and 80? (Round your answer to two decimal places.) % (b)What is the probability that a randomly chosen student earned an "A" (90 or above) on the test? (Round your answer to 4 decimal places.) (c) At what...
 The boxplots below show the distribution of test scores for two classes. Class A Class B 0 80 90 100 10 20 30 40 50 60 70 Test scores Which of the following statements is a valid conclusion that can be drawn from the boxplots? Choose all that apply. At least 25% of each class earned a B (80 or higher on the exam). Class B has more students than class A. Class A and B have approximately the same...
 uiz Instructions Question 5 The following boxplots show test scores for a first exam given in two different classes. Grades 100 90 80 70 60 class 1 class2 Variable Which class had the largest IQR? ® class 2 O class 1 Previous
 The graph illustrates the distribution of test scores taken by College Algebra students. The maximum possible score on the test was 140, while the mean score was 75 and the standard deviation was 15. 30 45 105 120 60 75 90 Distribution of Test Scores Using the Empirical Rule, What is the approximate percentage of students who scored between 45 and 105 on the test? % What is the approximate percentage of students who scored higher than 105 on the...
 The graph illustrates the distribution of test scores taken by
College Algebra students. The maximum possible score on the test
was 130, while the mean score was 77 and the standard deviation was
13. 38 51 64 77 90 103 116 Distribution of Test Scores What is the
approximate percentage of students who scored higher than 103 on
the test? % What is the approximate percentage of students who
scored between 64 and 77? % What is the approximate percentage...
The graph illustrates the distribution of test scores taken by
College Algebra students. The maximum possible score on the test
was 130, while the mean score was 77 and the standard deviation was
13. 38 51 64 77 90 103 116 Distribution of Test Scores What is the
approximate percentage of students who scored higher than 103 on
the test? % What is the approximate percentage of students who
scored between 64 and 77? % What is the approximate percentage...
 Can someone help with the last part? Not sure I understand
it
The boxplots below are for test scores from two sections (A and B) of the same course. Boxplot of Exam Scores for Class A and Class B Class 70 Exam Scores 50 60 80 90 100 a) Which section has the highest median score? The medians are the same b)Using the IQR as your measure, which section has the most spread in scores? The IQRs are the same...
Can someone help with the last part? Not sure I understand
it
The boxplots below are for test scores from two sections (A and B) of the same course. Boxplot of Exam Scores for Class A and Class B Class 70 Exam Scores 50 60 80 90 100 a) Which section has the highest median score? The medians are the same b)Using the IQR as your measure, which section has the most spread in scores? The IQRs are the same...
 Consider the following scatterplot, regression equation, and correlation of midterm and final exam scores for a class of 15 students. Which of the following are true statements? Select one answer ı points Y ะ 90.6-0.489x , r -0.602 110 100 90 80 , 5어 2 20 40 60 80 100 Mdterm Exam Score I. The same number of students scored 100 on the midterm exam as scored 100 on the final exam. II. Students who scored higher on the midterm...
 The two Stem-and-Leaf plots below are data set for two searate exams, let's call them Exam scores, and then cam 2 scores. These are fictional exam scores) Exam 2 3 29 4 568 51689 6 357 7 229 679 7 1 3 5 7 80245677 9 038 907 (a) Calculate the mean and the Five Number Summary for these two distributions. (Round to I decimal place if necessary.) Exam 1: Exam 2: Min Qi Median Q3 Max Min 01 Median...
Most questions answered within 3 hours.
-
Where is the error in this code sequence?
String s1 = "Hello";
String s2 = "ello";...
asked 10 months ago -
Financial data for Joel de Paris, Inc., for last year
follow:
Joel de Paris, Inc.
Balance...
asked 10 months ago -
Consider this reaction:
Al2(SO4)3 (aq)+ BaCl3
(aq) Al2Cl6 (aq)- +
3BaSO4(s) . What is the...
asked 10 months ago -
Suppose that Savneet is considering increasing her
recent random sample from 20 car rentals to 40...
asked 10 months ago -
Trucks arrive at an unloading terminal at an average rate of 120
per hour.
Trucks arrive...
asked 10 months ago -
Why are methanol and ethanol completely soluble in water while
octanol is not very little soluble....
asked 10 months ago -
A facilities manager at a university reads in a research report
that the mean amount of...
asked 10 months ago -
When the CuSO4 is rehydrated by adding water to the anhydrous
compound, is this an endothermic...
asked 10 months ago -
A ray of sunlight is passing from diamond into crown glass; the
angle of incidence is...
asked 10 months ago -
A block of mass 0.249 kg is placed on top of a light, vertical
spring of...
asked 10 months ago -
how do the kidneys compensate in the presences of acidosis
a) trigger hyperventilate
b) reserve acid...
asked 10 months ago -
Question 501 pts
The rental rate of capital to the firm increases. Which of the
following...
asked 10 months ago