For math class, the passing rate is 53%. Find the probability
that at least 23 students pass your course.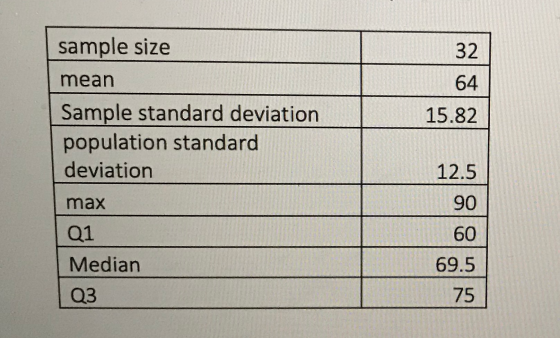
Homework Answers

Add Answer to:
For math class, the passing rate is 53%. Find the probability
that at least 23 students...
For math class, the passing rate is 53%. Find the probability that at least 23 students...
 For math class, the passing rate is 53%. Find the probability
that at least 23 students pass your course.
Please write notes readable.
sample size 32 mean 64 15.82 Sample standard deviation population standard deviation 12.5 max 90 Q1 60 Median 69.5 Q3 75
For math class, the passing rate is 53%. Find the probability
that at least 23 students pass your course.
Please write notes readable.
sample size 32 mean 64 15.82 Sample standard deviation population standard deviation 12.5 max 90 Q1 60 Median 69.5 Q3 75
If a math department chair says that the average score for math is 60 out of...
 If a math department chair says that the average score for math
is 60 out of 100 pts. Do you believe it? Show your work.
sample size 32 mean 64 15.82 Sample standard deviation population standard deviation 12.5 max 90 Q1 60 Median 69.5 Q3 75
If a math department chair says that the average score for math
is 60 out of 100 pts. Do you believe it? Show your work.
sample size 32 mean 64 15.82 Sample standard deviation population standard deviation 12.5 max 90 Q1 60 Median 69.5 Q3 75
The following data (excluded outlier) is collected from English Fall session homework #4. Assume that distribution...
The following data (excluded outlier) is collected from English Fall session homework #4. Assume that distribution is normally distributed. sample size 32 ,mean 64 ,Sample standard deviation 15.82 ,population standard deviation 12.5 ,max 90 ,Q1 60 ,Median 69.5, Q3 75 Your homework #4 Score is 32 1. Analyze your score based on the date above. 2. Assume that distribution is bell-shaped, find the percentage who scored greater than your homework score. Analyze your homework score based on the percentage you...
Please answer all questions! thanks :) VI/ Test scores from a math midterm are as follows:...
 Please
answer all questions! thanks :)
VI/ Test scores from a math midterm are as follows: 79, 90, 85, 89, 70, 59, 75, 64, 83, 78, 75, 77, 78, 77, 67, 85, 74, 52, 87, 72, 69, 76, 61, 77, 93, 86, 79, 90, 74, 67, 51, 75, 77, 82, 78, 60, 86, 72, 91, 95, 82 Complete the frequency distribution table to include all data a. Class Tallies Class Midpoint Relative Cumulative Frequency relative freq boundaries Frequency 51 57...
Please
answer all questions! thanks :)
VI/ Test scores from a math midterm are as follows: 79, 90, 85, 89, 70, 59, 75, 64, 83, 78, 75, 77, 78, 77, 67, 85, 74, 52, 87, 72, 69, 76, 61, 77, 93, 86, 79, 90, 74, 67, 51, 75, 77, 82, 78, 60, 86, 72, 91, 95, 82 Complete the frequency distribution table to include all data a. Class Tallies Class Midpoint Relative Cumulative Frequency relative freq boundaries Frequency 51 57...
A MATH 3003 Probability and Statistics class has 32 registered students, 23 female and 9 male....
 A MATH 3003 Probability and Statistics class has 32 registered students, 23 female and 9 male. An all male committee of president, vice-president, and executor will be selected in that order from this class. How many different committees can be assembled? 84 4960 None of the alternatives. 10,626 504
Select the best alternative. A MATH 3003 Probability and Statistics class has 32 registered students, 23...
 Select the best alternative. A MATH 3003 Probability and Statistics class has 32 registered students, 23 female and 9 male. A committee of a female president, female vice-president, and male executor will be selected in that order from this class. How many different committees can be assembled? 10,626 504 None of the alternatives. 1656 4554
2. A statistician wishing to test a hypothesis that students score at least 75% on the...
 2. A statistician wishing to test a hypothesis that students score at least 75% on the final exam n an introductory statistics course decides to randomly select 20 students in the class and ave them take the exam early. The average score of the 20 students on the exam was 78% and the standard deviation in the population is known to be σ-15%. The P-value for the hypothesis H: μ 75 vs. H : μ > 75 is: A) 0.814....
Example: Students taking an intro stats class reported the number of credit hours that they were...
 Example: Students taking an intro stats class reported the number of credit hours that they were taking that quarter. Summary statistics are shown in the table. MeanStd Dev Min 16.65 Q1 15 Median 16 Q3 19 Max 28 2.96 5 Suppose the college charges S73 per credit hour plus a flat fee of S35 per quarter. For example, a student taking 12 credit hours would pay $35 12(S73)-S911 for that quarter. What is the mean fee paid? 4 of 27...
02 The following scores represent the final examination grades for an elementary statistics course: 23 60...
 02 The following scores represent the final examination grades for an elementary statistics course: 23 60 79 32 57 74 52 70 82 36 80 77 81 95 41 65 92 85 55 76 52 10 64 75 78 25 80 98 81 67 41 71 83 54 64 72 88 62 74 43 60 78 89 76 84 48 84 90 15 79 34 67 17 82 69 74 63 80 85 61 Calculate: . Stem and leaf ....
1- Suppose there are only 38 students in advance statistics class and final scores of these...
 1- Suppose there are only 38 students in advance statistics class and final scores of these 38 students are: 10 34 45 55 63 75 class lit 23 34 49 56 64 82 24 36 50 58 65 82 26 41 51 59 71 95- 32 41 52 60 73 33 45 54 62 74 s lin 46 54 63 74 a- Construct grouped frequency distribution table for this dataset with relative and cumulative frequencies (with closed intervals). b- Find...
 For math class, the passing rate is 53%. Find the probability
that at least 23 students pass your course.
Please write notes readable.
sample size 32 mean 64 15.82 Sample standard deviation population standard deviation 12.5 max 90 Q1 60 Median 69.5 Q3 75
For math class, the passing rate is 53%. Find the probability
that at least 23 students pass your course.
Please write notes readable.
sample size 32 mean 64 15.82 Sample standard deviation population standard deviation 12.5 max 90 Q1 60 Median 69.5 Q3 75
 If a math department chair says that the average score for math
is 60 out of 100 pts. Do you believe it? Show your work.
sample size 32 mean 64 15.82 Sample standard deviation population standard deviation 12.5 max 90 Q1 60 Median 69.5 Q3 75
If a math department chair says that the average score for math
is 60 out of 100 pts. Do you believe it? Show your work.
sample size 32 mean 64 15.82 Sample standard deviation population standard deviation 12.5 max 90 Q1 60 Median 69.5 Q3 75
 Please
answer all questions! thanks :)
VI/ Test scores from a math midterm are as follows: 79, 90, 85, 89, 70, 59, 75, 64, 83, 78, 75, 77, 78, 77, 67, 85, 74, 52, 87, 72, 69, 76, 61, 77, 93, 86, 79, 90, 74, 67, 51, 75, 77, 82, 78, 60, 86, 72, 91, 95, 82 Complete the frequency distribution table to include all data a. Class Tallies Class Midpoint Relative Cumulative Frequency relative freq boundaries Frequency 51 57...
Please
answer all questions! thanks :)
VI/ Test scores from a math midterm are as follows: 79, 90, 85, 89, 70, 59, 75, 64, 83, 78, 75, 77, 78, 77, 67, 85, 74, 52, 87, 72, 69, 76, 61, 77, 93, 86, 79, 90, 74, 67, 51, 75, 77, 82, 78, 60, 86, 72, 91, 95, 82 Complete the frequency distribution table to include all data a. Class Tallies Class Midpoint Relative Cumulative Frequency relative freq boundaries Frequency 51 57...
 A MATH 3003 Probability and Statistics class has 32 registered students, 23 female and 9 male. An all male committee of president, vice-president, and executor will be selected in that order from this class. How many different committees can be assembled? 84 4960 None of the alternatives. 10,626 504
 Select the best alternative. A MATH 3003 Probability and Statistics class has 32 registered students, 23 female and 9 male. A committee of a female president, female vice-president, and male executor will be selected in that order from this class. How many different committees can be assembled? 10,626 504 None of the alternatives. 1656 4554
 2. A statistician wishing to test a hypothesis that students score at least 75% on the final exam n an introductory statistics course decides to randomly select 20 students in the class and ave them take the exam early. The average score of the 20 students on the exam was 78% and the standard deviation in the population is known to be σ-15%. The P-value for the hypothesis H: μ 75 vs. H : μ > 75 is: A) 0.814....
 Example: Students taking an intro stats class reported the number of credit hours that they were taking that quarter. Summary statistics are shown in the table. MeanStd Dev Min 16.65 Q1 15 Median 16 Q3 19 Max 28 2.96 5 Suppose the college charges S73 per credit hour plus a flat fee of S35 per quarter. For example, a student taking 12 credit hours would pay $35 12(S73)-S911 for that quarter. What is the mean fee paid? 4 of 27...
 02 The following scores represent the final examination grades for an elementary statistics course: 23 60 79 32 57 74 52 70 82 36 80 77 81 95 41 65 92 85 55 76 52 10 64 75 78 25 80 98 81 67 41 71 83 54 64 72 88 62 74 43 60 78 89 76 84 48 84 90 15 79 34 67 17 82 69 74 63 80 85 61 Calculate: . Stem and leaf ....
 1- Suppose there are only 38 students in advance statistics class and final scores of these 38 students are: 10 34 45 55 63 75 class lit 23 34 49 56 64 82 24 36 50 58 65 82 26 41 51 59 71 95- 32 41 52 60 73 33 45 54 62 74 s lin 46 54 63 74 a- Construct grouped frequency distribution table for this dataset with relative and cumulative frequencies (with closed intervals). b- Find...
Most questions answered within 3 hours.
-
Where is the error in this code sequence?
String s1 = "Hello";
String s2 = "ello";...
asked 10 months ago -
Financial data for Joel de Paris, Inc., for last year
follow:
Joel de Paris, Inc.
Balance...
asked 10 months ago -
Consider this reaction:
Al2(SO4)3 (aq)+ BaCl3
(aq) Al2Cl6 (aq)- +
3BaSO4(s) . What is the...
asked 10 months ago -
Suppose that Savneet is considering increasing her
recent random sample from 20 car rentals to 40...
asked 10 months ago -
Trucks arrive at an unloading terminal at an average rate of 120
per hour.
Trucks arrive...
asked 10 months ago -
Why are methanol and ethanol completely soluble in water while
octanol is not very little soluble....
asked 10 months ago -
A facilities manager at a university reads in a research report
that the mean amount of...
asked 10 months ago -
When the CuSO4 is rehydrated by adding water to the anhydrous
compound, is this an endothermic...
asked 10 months ago -
A ray of sunlight is passing from diamond into crown glass; the
angle of incidence is...
asked 10 months ago -
A block of mass 0.249 kg is placed on top of a light, vertical
spring of...
asked 10 months ago -
how do the kidneys compensate in the presences of acidosis
a) trigger hyperventilate
b) reserve acid...
asked 10 months ago -
Question 501 pts
The rental rate of capital to the firm increases. Which of the
following...
asked 10 months ago