I need some help with this question.

Homework Answers

Add Answer to:
I need some help with this question.
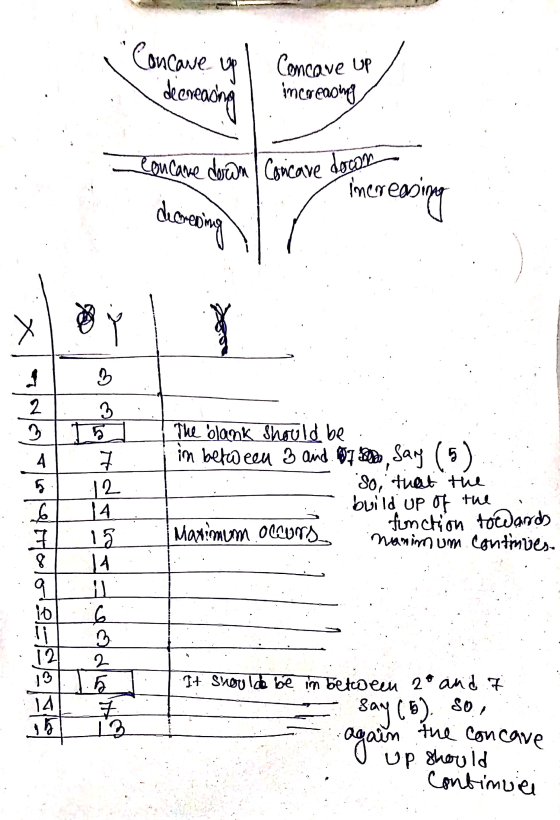
Create a table of values and an associated graph...
Create a table of values and an associated graph that are concave up twice and concave...
 Create a table of values and an associated graph that are concave up twice and concave down once. 24 * 0+
I need to create a C++ program to simulate a Round Robin Tournament. For example: if...
I need to create a C++ program to simulate a Round Robin Tournament. For example: if a user enters 4, a 4 team tournament would output: 1 2 3 4 2 1 4 3 3 4 1 2 4 3 2 1 My goal is to create this program using a two dimentional array, however I am unsure how to go about doing initializing everything. How do I write a constructor for this? The following is the class declaration I...
I need help in SQL management studio please. Question: Create the same query as query 5,...
I need help in SQL management studio please. Question: Create the same query as query 5, but only include artists if they have 'Pop' Genre. Previous question: Create a list of all composers and artists in your database. Include two columns in your record set (the names of the returned columns are in brackets): 'Composer/Artist Name' and 'Type' (which will indicate whether your results are from the composer or artist table). Order by 'Composer/Artist Name'. This is the answer for...
i need help with this page thanks Student's Name Solve and graph the compound inequality, if possible. 11. -...
 i need help with this page
thanks
Student's Name Solve and graph the compound inequality, if possible. 11. -6 <3(x +4) s 18 -8 Solve the equation, if possible. 12.-316n-21 +5=8 Label each statement as "true" or "false." If "Talse," correct the underlined portion. 13. If 3 <x, ten 3 + y<X+y 14. If bw -7K-3, then w-7-3 or w-73 15. If -4<-2t+ 6< 10, then 21+62-5 16. If ly + 81+226, then y + 8 =24 Translate and solve....
i need help with this page
thanks
Student's Name Solve and graph the compound inequality, if possible. 11. -6 <3(x +4) s 18 -8 Solve the equation, if possible. 12.-316n-21 +5=8 Label each statement as "true" or "false." If "Talse," correct the underlined portion. 13. If 3 <x, ten 3 + y<X+y 14. If bw -7K-3, then w-7-3 or w-73 15. If -4<-2t+ 6< 10, then 21+62-5 16. If ly + 81+226, then y + 8 =24 Translate and solve....
I need help with this excercise. its for population parameters for Terrestrial Ecology. points) Life Tables...
 I
need help with this excercise.
its for population parameters for Terrestrial Ecology.
points) Life Tables and Survivorship Curves Life Table for the 1978 cohort of Geospiza scandens on Isla Daphne (Galapagos) Age Class n. 1d. 0-1 210 1-2 91 2-3 78 70 4-5 65 5-6 62 6-7 42 7-8 23 8-9 15 9-10 14 10-11 11 11-12 10 12-13 4 133 Survivorship Curve for 1978 Cohort of Geospiza scandens * 0.1 0.01 0 1 2 3 4 5 6...
I
need help with this excercise.
its for population parameters for Terrestrial Ecology.
points) Life Tables and Survivorship Curves Life Table for the 1978 cohort of Geospiza scandens on Isla Daphne (Galapagos) Age Class n. 1d. 0-1 210 1-2 91 2-3 78 70 4-5 65 5-6 62 6-7 42 7-8 23 8-9 15 9-10 14 10-11 11 11-12 10 12-13 4 133 Survivorship Curve for 1978 Cohort of Geospiza scandens * 0.1 0.01 0 1 2 3 4 5 6...
Need to create pH vs. volume graph and fill out table from experimental data below. I have posted...
 Need to create pH vs. volume graph and fill out table
from experimental data below. I have posted the pH vs. volume graph
I have created, not sure if it is right, need to help finding
stoichiometric point. I am also required to fill out the table
posted below. MY LAB GROUP BAILED ON ME PLZ
HELP!!!!!!!!!!!!!!!!!!!!!!!!!
Volume (mL)
pH
0
4.24
1
4.28
2
4.33
3
4.37
4
4.4
5
4.45
6
4.49
7
4.52
8
4.55
9
4.58...
Need to create pH vs. volume graph and fill out table
from experimental data below. I have posted the pH vs. volume graph
I have created, not sure if it is right, need to help finding
stoichiometric point. I am also required to fill out the table
posted below. MY LAB GROUP BAILED ON ME PLZ
HELP!!!!!!!!!!!!!!!!!!!!!!!!!
Volume (mL)
pH
0
4.24
1
4.28
2
4.33
3
4.37
4
4.4
5
4.45
6
4.49
7
4.52
8
4.55
9
4.58...
Table 4. 1975 cohort of G. conden x 5. To visualize survivorship in a graph, it...
 Table 4. 1975 cohort of G. conden x 5. To visualize survivorship in a graph, it is often helpful to calculate the log of survivorship so that the graphed data are more reasonably scaled. Complete Table 4 to the right to log-transform the survivorship data for the 1975 cohort of G. scandens (round to the hundredths place). 0 Nx 82 42 1 2 3 4. Use your values from Table 4 and the grid below to create a survivorship curve...
I need help on this please. I need to create an outline for inform to speech....
I need help on this please. I need to create an outline for inform to speech. Your task is to prepare a 5 minute speech to inform. This information can be about the role of nurses to the autistic children. 1. Audience Analysis Questions 2. tiltle 3. general purpose 4. specific purpose 5. attention 6. Relate to Audience Tells listeners how they will benefit from hearing your speech. Uses “you” language. May refer to audience analysis survey results. 7. relate...
Complete the table and graph the cumulative relative frequency of heads MR. Harrison tossed a coin 25 times resulting i...
 Complete the table and graph the cumulative relative frequency
of heads
MR. Harrison tossed a coin 25 times resulting in 10 tails. Complete the result in the following table and graph the commulative relatiove frequency of he Commulative relative frequency of H Commulative frequency Toss Number outcome(H or T) 1 2 3 4 5 6 7 8 9 10 11 12 13 14 15 16 17 18 19 20
MR. Harrison tossed a coin 25 times resulting in 10 tails....
Complete the table and graph the cumulative relative frequency
of heads
MR. Harrison tossed a coin 25 times resulting in 10 tails. Complete the result in the following table and graph the commulative relatiove frequency of he Commulative relative frequency of H Commulative frequency Toss Number outcome(H or T) 1 2 3 4 5 6 7 8 9 10 11 12 13 14 15 16 17 18 19 20
MR. Harrison tossed a coin 25 times resulting in 10 tails....
I really do not understand how to read these.... If I can get some help that...
 I really do not understand how
to read these.... If I can get some help that would be
amazing!!!
DLL 00 KIMAX an w M 9 ma N N 00 a w 00 N O 16 16 15 - 15 0.6 14 14 13 13 0.5 12 12 11 11 10 10 10 KIMAX 10.4 9 8 0.3 பாப்பா பாடல் 7 6 5 0.2 3 0.1 2 1 1 cm A cm B cm C m Gradations: A B C...
I really do not understand how
to read these.... If I can get some help that would be
amazing!!!
DLL 00 KIMAX an w M 9 ma N N 00 a w 00 N O 16 16 15 - 15 0.6 14 14 13 13 0.5 12 12 11 11 10 10 10 KIMAX 10.4 9 8 0.3 பாப்பா பாடல் 7 6 5 0.2 3 0.1 2 1 1 cm A cm B cm C m Gradations: A B C...
 Create a table of values and an associated graph that are concave up twice and concave down once. 24 * 0+
 i need help with this page
thanks
Student's Name Solve and graph the compound inequality, if possible. 11. -6 <3(x +4) s 18 -8 Solve the equation, if possible. 12.-316n-21 +5=8 Label each statement as "true" or "false." If "Talse," correct the underlined portion. 13. If 3 <x, ten 3 + y<X+y 14. If bw -7K-3, then w-7-3 or w-73 15. If -4<-2t+ 6< 10, then 21+62-5 16. If ly + 81+226, then y + 8 =24 Translate and solve....
i need help with this page
thanks
Student's Name Solve and graph the compound inequality, if possible. 11. -6 <3(x +4) s 18 -8 Solve the equation, if possible. 12.-316n-21 +5=8 Label each statement as "true" or "false." If "Talse," correct the underlined portion. 13. If 3 <x, ten 3 + y<X+y 14. If bw -7K-3, then w-7-3 or w-73 15. If -4<-2t+ 6< 10, then 21+62-5 16. If ly + 81+226, then y + 8 =24 Translate and solve....
 I
need help with this excercise.
its for population parameters for Terrestrial Ecology.
points) Life Tables and Survivorship Curves Life Table for the 1978 cohort of Geospiza scandens on Isla Daphne (Galapagos) Age Class n. 1d. 0-1 210 1-2 91 2-3 78 70 4-5 65 5-6 62 6-7 42 7-8 23 8-9 15 9-10 14 10-11 11 11-12 10 12-13 4 133 Survivorship Curve for 1978 Cohort of Geospiza scandens * 0.1 0.01 0 1 2 3 4 5 6...
I
need help with this excercise.
its for population parameters for Terrestrial Ecology.
points) Life Tables and Survivorship Curves Life Table for the 1978 cohort of Geospiza scandens on Isla Daphne (Galapagos) Age Class n. 1d. 0-1 210 1-2 91 2-3 78 70 4-5 65 5-6 62 6-7 42 7-8 23 8-9 15 9-10 14 10-11 11 11-12 10 12-13 4 133 Survivorship Curve for 1978 Cohort of Geospiza scandens * 0.1 0.01 0 1 2 3 4 5 6...
 Need to create pH vs. volume graph and fill out table
from experimental data below. I have posted the pH vs. volume graph
I have created, not sure if it is right, need to help finding
stoichiometric point. I am also required to fill out the table
posted below. MY LAB GROUP BAILED ON ME PLZ
HELP!!!!!!!!!!!!!!!!!!!!!!!!!
Volume (mL)
pH
0
4.24
1
4.28
2
4.33
3
4.37
4
4.4
5
4.45
6
4.49
7
4.52
8
4.55
9
4.58...
Need to create pH vs. volume graph and fill out table
from experimental data below. I have posted the pH vs. volume graph
I have created, not sure if it is right, need to help finding
stoichiometric point. I am also required to fill out the table
posted below. MY LAB GROUP BAILED ON ME PLZ
HELP!!!!!!!!!!!!!!!!!!!!!!!!!
Volume (mL)
pH
0
4.24
1
4.28
2
4.33
3
4.37
4
4.4
5
4.45
6
4.49
7
4.52
8
4.55
9
4.58...
 Table 4. 1975 cohort of G. conden x 5. To visualize survivorship in a graph, it is often helpful to calculate the log of survivorship so that the graphed data are more reasonably scaled. Complete Table 4 to the right to log-transform the survivorship data for the 1975 cohort of G. scandens (round to the hundredths place). 0 Nx 82 42 1 2 3 4. Use your values from Table 4 and the grid below to create a survivorship curve...
 Complete the table and graph the cumulative relative frequency
of heads
MR. Harrison tossed a coin 25 times resulting in 10 tails. Complete the result in the following table and graph the commulative relatiove frequency of he Commulative relative frequency of H Commulative frequency Toss Number outcome(H or T) 1 2 3 4 5 6 7 8 9 10 11 12 13 14 15 16 17 18 19 20
MR. Harrison tossed a coin 25 times resulting in 10 tails....
Complete the table and graph the cumulative relative frequency
of heads
MR. Harrison tossed a coin 25 times resulting in 10 tails. Complete the result in the following table and graph the commulative relatiove frequency of he Commulative relative frequency of H Commulative frequency Toss Number outcome(H or T) 1 2 3 4 5 6 7 8 9 10 11 12 13 14 15 16 17 18 19 20
MR. Harrison tossed a coin 25 times resulting in 10 tails....
 I really do not understand how
to read these.... If I can get some help that would be
amazing!!!
DLL 00 KIMAX an w M 9 ma N N 00 a w 00 N O 16 16 15 - 15 0.6 14 14 13 13 0.5 12 12 11 11 10 10 10 KIMAX 10.4 9 8 0.3 பாப்பா பாடல் 7 6 5 0.2 3 0.1 2 1 1 cm A cm B cm C m Gradations: A B C...
I really do not understand how
to read these.... If I can get some help that would be
amazing!!!
DLL 00 KIMAX an w M 9 ma N N 00 a w 00 N O 16 16 15 - 15 0.6 14 14 13 13 0.5 12 12 11 11 10 10 10 KIMAX 10.4 9 8 0.3 பாப்பா பாடல் 7 6 5 0.2 3 0.1 2 1 1 cm A cm B cm C m Gradations: A B C...
Most questions answered within 3 hours.
-
Where is the error in this code sequence?
String s1 = "Hello";
String s2 = "ello";...
asked 10 months ago -
Financial data for Joel de Paris, Inc., for last year
follow:
Joel de Paris, Inc.
Balance...
asked 10 months ago -
Consider this reaction:
Al2(SO4)3 (aq)+ BaCl3
(aq) Al2Cl6 (aq)- +
3BaSO4(s) . What is the...
asked 10 months ago -
Suppose that Savneet is considering increasing her
recent random sample from 20 car rentals to 40...
asked 10 months ago -
Trucks arrive at an unloading terminal at an average rate of 120
per hour.
Trucks arrive...
asked 10 months ago -
Why are methanol and ethanol completely soluble in water while
octanol is not very little soluble....
asked 10 months ago -
A facilities manager at a university reads in a research report
that the mean amount of...
asked 10 months ago -
When the CuSO4 is rehydrated by adding water to the anhydrous
compound, is this an endothermic...
asked 10 months ago -
A ray of sunlight is passing from diamond into crown glass; the
angle of incidence is...
asked 10 months ago -
A block of mass 0.249 kg is placed on top of a light, vertical
spring of...
asked 10 months ago -
how do the kidneys compensate in the presences of acidosis
a) trigger hyperventilate
b) reserve acid...
asked 10 months ago -
Question 501 pts
The rental rate of capital to the firm increases. Which of the
following...
asked 10 months ago