State the hypotheses and identify the claim, find the critical value(s), compute the test value, make...
State the hypotheses and identify the claim, find the critical value(s), compute the test value, make the decision, summarize the results (make the appropriate statement of the results of the claim included rejection or non-rejection of the null hypothesis). Please show all of your work.
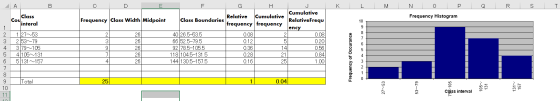
3)The number of annual precipitation days for one-half of the 50 largest U.S. cities is listed below. Do the following: 131 94 136 88 116 77 127 79 47 97 116 123 88 102 27 80 156 133 117 55 112 98 55 90 125
a)Construct a frequency distribution for the data (include class boundaries in the table) with 5 classes.
b)Graph its histogram. c)Plot its cumulative frequency (ogive).
d)Find the mode of the data.
e)Find the mean, for the grouped data.
f)Find the variance and standard deviation for grouped data.
g)Find the z score and percentile for the value 98.
Homework Answers
a)Construct a frequency distribution for the data (include class boundaries in the table) with 5 classes.
Formula Reference:
b)Graph its histogram:

c)Plot its cumulative frequency (ogive):

Ogive:

d)Find the mode of the data:

Mean,variance and std dev:

Formula Reference:

Percentile:

z score:
z = (x - μ) / σ
z = (98 - 100.32) / 29.16
z = -0.08
Add Answer to:
State the hypotheses and identify the claim, find the critical
value(s), compute the test value, make...
The number of annual precipitation days for one-half of the 50 largest U.S. cities is listed...
The number of annual precipitation days for one-half of the 50 largest U.S. cities is listed below. Do the following: 131 94 136 88 116 77 127 79 47 97 116 123 88 102 27 80 156 133 117 55 112 98 55 90 125 a) Construct a frequency distribution for the data (include class boundaries in the table) with 5 classes. b) Graph its histogram. c) Plot its cumulative frequency (ogive). d) Find the mode of the data. e)...
3) The number of annual precipitation days for one-half of the 50 largest U.S. cities is...
 3) The number of annual precipitation days for one-half of the 50 largest U.S. cities is listed below. Do the following: 131 94 136 88 116 123 88 102 112 98 55 90 116 27 125 77 80 127 79 156 47 117 97 55 133 a) Construct a frequency distribution for the data (include class boundaries in the table) with 5 classes. b) Graph its histogram. c) Plot its cumulative frequency (ogive). d) Find the mode of the data....
State the hypotheses and identify the claim, find the critical value(s), compute the test value, make...
State the hypotheses and identify the claim, find the critical value(s), compute the test value, make the decision, summarize the results (make the appropriate statement of the results of the claim included rejection of non rejection of the null hypothesis). Please show ALL work. DO NOT USE THE P VALUE. Please include a bell graph. Is there a significant difference at a=0.10 in the average height in feet of high towers in Europe and the ones in South Africa? The...
State the hypotheses and identify the claim, find the critical value(s), compute the test value, make...
State the hypotheses and identify the claim, find the critical value(s), compute the test value, make the decision, summarize the results (make the appropriate statement of the results of the claim included rejection or non-rejection of the null hypothesis). Please show all of your work. The probability that Sam parks in a no-parking zoneand gets a parking ticket is 0.12, and the probability that Sam cannot find a legal parking space and has to park in the no-parking zone is...
State the hypotheses and identify the claim, find the critical value(s), compute the test value, make...
State the hypotheses and identify the claim, find the critical value(s), compute the test value, make the decision, summarize the results (make the appropriate statement of the results of the claim included rejection or non-rejection of the null hypothesis). Please show all of your work. A researcher wishes to see if students show a time preference for anatomy labs. A sample of four lab classes shows enrollment. At = 0.10, do the students show a time preference for the labs?...
State the hypotheses and identify the claim, find the critical value(s), compute the test value, make...
State the hypotheses and identify the claim, find the critical value(s), compute the test value, make the decision, summarize the results (make the appropriate statement of the results of the claim included rejection or non-rejection of the null hypothesis). Please show all of your work. 1)A researcher wishes to see if students show a time preference for anatomy labs. A sample of four lab classes shows the enrollment. A= 0.10, do the students show a time preference for the labs?...
State the hypotheses and identify the claim, find the critical value(s), compute the test value, make...
State the hypotheses and identify the claim, find the critical value(s), compute the test value, make the decision, summarize the results (make the appropriate statement of the results of the claim included rejection or non-rejection of the null hypothesis). Solve WITHOUT the use of P value. Please show all of your work. A researcher wishes to see if students show a time preference for anatomy labs. A sample of four lab classes shows the enrollment. At a=0.10, do the students...
State the hypotheses and identify the claim, find the critical value(s), compute the test value, make...
State the hypotheses and identify the claim, find the critical value(s), compute the test value, make the decision, summarize the results (make the appropriate statement of the results of the claim included rejection or non-rejection of the null hypothesis). Please show all of your work. Four clubs were randomly selected, and quantity of their members in the clubs are noted. At = 0.01, can it be concluded that there is a dependent relationship between the clubs and the political party...
State the hypotheses and identify the claim, find the critical value(s), compute the test value, make...
State the hypotheses and identify the claim, find the critical value(s), compute the test value, make the decision, summarize the results (make the appropriate statement of the results of the claim included rejection or non-rejection of the null hypothesis). Please show ALL of your work. Include a bell graph. Four clubs were randomly selected, and quantity of their members in the clubs are noted. At = 0.01, can it be concluded that there is a dependent relationship between the clubs...
State the hypotheses and identify the claim, find the critical value(s), compute the test value, make...
State the hypotheses and identify the claim, find the critical value(s), compute the test value, make the decision, summarize the results (make the appropriate statement of the results of the claim included rejection or non-rejection of the null hypothesis). Please show all of your work. 2)Four clubs were randomly selected, and quantity of their members in the clubs are noted. At = 0.01, can it be concluded that there is a dependent relationship between the clubs and the political party...
 3) The number of annual precipitation days for one-half of the 50 largest U.S. cities is listed below. Do the following: 131 94 136 88 116 123 88 102 112 98 55 90 116 27 125 77 80 127 79 156 47 117 97 55 133 a) Construct a frequency distribution for the data (include class boundaries in the table) with 5 classes. b) Graph its histogram. c) Plot its cumulative frequency (ogive). d) Find the mode of the data....
Most questions answered within 3 hours.
-
Where is the error in this code sequence?
String s1 = "Hello";
String s2 = "ello";...
asked 10 months ago -
Financial data for Joel de Paris, Inc., for last year
follow:
Joel de Paris, Inc.
Balance...
asked 10 months ago -
Consider this reaction:
Al2(SO4)3 (aq)+ BaCl3
(aq) Al2Cl6 (aq)- +
3BaSO4(s) . What is the...
asked 10 months ago -
Suppose that Savneet is considering increasing her
recent random sample from 20 car rentals to 40...
asked 10 months ago -
Trucks arrive at an unloading terminal at an average rate of 120
per hour.
Trucks arrive...
asked 10 months ago -
Why are methanol and ethanol completely soluble in water while
octanol is not very little soluble....
asked 10 months ago -
A facilities manager at a university reads in a research report
that the mean amount of...
asked 10 months ago -
When the CuSO4 is rehydrated by adding water to the anhydrous
compound, is this an endothermic...
asked 10 months ago -
A ray of sunlight is passing from diamond into crown glass; the
angle of incidence is...
asked 10 months ago -
A block of mass 0.249 kg is placed on top of a light, vertical
spring of...
asked 10 months ago -
how do the kidneys compensate in the presences of acidosis
a) trigger hyperventilate
b) reserve acid...
asked 10 months ago -
Question 501 pts
The rental rate of capital to the firm increases. Which of the
following...
asked 10 months ago