

Homework Answers
| SSE =Syy-(Sxy)2/Sxx= | 311.508772 | |
| s2 =SSE/(n-2)= | 44.5013 | |
| std error σ = | =se =√s2= | 6.6709 |
| std error of slope =se(β1) =s/√Sxx= | 1.082167 | |
a)
| null hypothesis: Ho: β1= | 0 | |
| Alternate Hypothesis: Ha: β1≠ | 0 | |
| test stat t =(b1-β1)/se(β1)= | -2.80 | |
| p value = | 0.026 | (from excel:tdist(-2.805,7,2) |
fail to reject the null hypothesis , there is not sufficient evidence,,,,, slope is not different from zero,
b)
| for 98 % CI value of t= | 2.998 | (from excel:tinv(0.02,7) | |
| margin of error E=t*std error = | 3.2443 | ||
| lower bound=b1+E= | -6.279 | ||
| Upper bound=b1+E= | 0.209 | ||
98% confidence interval =(-6.279 , 0.209)
c)
there is not a linear ,,,,,,,,,,,,null hypothesis is not rejected,.,,,,,contains 0.
Add Answer to:
Suppose a teacher recorded the attendance of her students in a recent statistics class because she...
Suppose a teacher recorded the attendance of her students in a recent statistics class because she...
 Suppose a teacher recorded the attendance of her students in a
recent statistics class because she wanted to investigate the
linear relationship between the number of classes they missed and
their final grades. The accompanying table shows these data for a
random sample of nine students
Classes Missed Final Grade
4 73
6 81
1 92
4 72
0 94
2 86
0 89
5 87
2 96
Suppose a teacher recorded the attendance of her students in a recent...
Suppose a teacher recorded the attendance of her students in a
recent statistics class because she wanted to investigate the
linear relationship between the number of classes they missed and
their final grades. The accompanying table shows these data for a
random sample of nine students
Classes Missed Final Grade
4 73
6 81
1 92
4 72
0 94
2 86
0 89
5 87
2 96
Suppose a teacher recorded the attendance of her students in a recent...
Suppose a teacher recorded the attendance of her students in a recent statistics class because she...
 Suppose a teacher recorded the attendance of her students in a recent statistics class because she wanted to investigate the linear relationship between the number of classes they missed and their final grades. The accompanying table shows these data for a random sample of nine students. Complete parts a through c. Click the icon to view the table showing missed classes and final grade. a. Calculate the correlation coefficient for this sample. The correlation coefficient is I. (Type an integer...
5 7 8 10 11 12 Suppose a teacher recorded the attendance of her students in...
 5 7 8 10 11 12 Suppose a teacher recorded the attendance of her students in a recent statistics class because she wanted to investigate the linear relationship between the number of classes they missed and their final grades. The accompanying table shows these data for a random sample of nine students. Complete parts a through c. Click the icon to view the table showing missed classes and final grade. a. Calculate the correlation coefficient for this sample. The correlation...
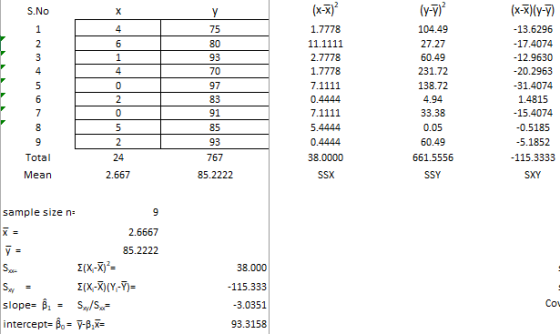
Missed Classes Final Grade 4 75 6 80 1 91 4 71 0 95 2 83...
 Missed Classes Final Grade
4 75
6 80
1 91
4 71
0 95
2 83
0 91
5 86
2 96
Suppose a teacher recorded the attendance of her students in a recent statistics class because she wanted to investigate the linear relationship between the number of classes they missed and their final grades. The accompanying table shows these data for a random sample of nine students. Complete parts a through c. Click the icon to view the table...
Missed Classes Final Grade
4 75
6 80
1 91
4 71
0 95
2 83
0 91
5 86
2 96
Suppose a teacher recorded the attendance of her students in a recent statistics class because she wanted to investigate the linear relationship between the number of classes they missed and their final grades. The accompanying table shows these data for a random sample of nine students. Complete parts a through c. Click the icon to view the table...
Suppose a teacher recorded the attendance of her students in a recent statistics class because she wanted to investigate the linear relationship between the number of classes a nest and their final grades the company table shows these data for random stud
D. Predict a final grade for student who missed six classesE. Calculate the SSTF. Partition the SST into the SSR and the SSESSR= and SSE=
In an effort to improve final grades in her class, a professor tried a new method...
 In an effort to improve final grades in her class, a professor tried a new method of evaluation with one of her intro stats classes last term. A test of the null hypothesis that her old method (used with one class) and new method (used with her other class) don't differ in the mean final grade for students yielded a p-value of 0.095. Would a 95% confidence interval for Hold-Hnew include 0? Explain your answer
Can a pretest on mathematics skills predict success in a statistics course? The 82 students in an...
Can a pretest on mathematics skills predict success in a statistics course? The 82 students in an introductory statistics class took a pretest at the beginning of the semester. The least-squares regression line for predicting the score y on the final exam from the pretest score x was ŷ = 9.8 + 0.74x. The standard error of b1 was 0.41. (a) Test the null hypothesis that there is no linear relationship between the pretest score and the score on the...
Can a pretest on mathematics skills predict success in a statistics course? The 82 students in...
Can a pretest on mathematics skills predict success in a statistics course? The 82 students in an introductory statistics class took a pretest at the beginning of the semester. The least-squares regression line for predicting the score y on the final exam from the pretest score x was ŷ = 9.4 + 0.78x. The standard error of b1 was 0.44. (a) Test the null hypothesis that there is no linear relationship between the pretest score and the score on the...
Well help Two professors at a local college developed a new teaching curriculum designed to increase...
 Well help Two professors at a local college developed a new teaching curriculum designed to increase students' grades in math classes. In a typical developmental math course 56% of the students complete the course with a letter grade of A, B, or C. In the experimental course, of the 17 students enrolled, 13 completed the course with a letter grade of A, B, or C. Is the experimental course effective at the u=0.01 level of significance? Complete parts (a) through...
Suppose that a researcher, using data on class size (CS) and average test scores from 100...
Suppose that a researcher, using data on class size (CS) and average test scores from 100 third-grade classes, estimates the OLS regression. TestScore = 504.7880 + (-5.6454) x CS, R^2 = 0.08, SER = 11.2 (19.7880) (2.1658) Construct a 95% confidence interval for B1, the regression slope coefficient. The 95% confidence interval for B1, the regression slope coefficient, is (-9.89, -1.40). The t-statistic for the two-sided test of the null hypothesis H0: B1 = 0 is ? (Round to four...
 Suppose a teacher recorded the attendance of her students in a
recent statistics class because she wanted to investigate the
linear relationship between the number of classes they missed and
their final grades. The accompanying table shows these data for a
random sample of nine students
Classes Missed Final Grade
4 73
6 81
1 92
4 72
0 94
2 86
0 89
5 87
2 96
Suppose a teacher recorded the attendance of her students in a recent...
Suppose a teacher recorded the attendance of her students in a
recent statistics class because she wanted to investigate the
linear relationship between the number of classes they missed and
their final grades. The accompanying table shows these data for a
random sample of nine students
Classes Missed Final Grade
4 73
6 81
1 92
4 72
0 94
2 86
0 89
5 87
2 96
Suppose a teacher recorded the attendance of her students in a recent...
 Suppose a teacher recorded the attendance of her students in a recent statistics class because she wanted to investigate the linear relationship between the number of classes they missed and their final grades. The accompanying table shows these data for a random sample of nine students. Complete parts a through c. Click the icon to view the table showing missed classes and final grade. a. Calculate the correlation coefficient for this sample. The correlation coefficient is I. (Type an integer...
 5 7 8 10 11 12 Suppose a teacher recorded the attendance of her students in a recent statistics class because she wanted to investigate the linear relationship between the number of classes they missed and their final grades. The accompanying table shows these data for a random sample of nine students. Complete parts a through c. Click the icon to view the table showing missed classes and final grade. a. Calculate the correlation coefficient for this sample. The correlation...
 Missed Classes Final Grade
4 75
6 80
1 91
4 71
0 95
2 83
0 91
5 86
2 96
Suppose a teacher recorded the attendance of her students in a recent statistics class because she wanted to investigate the linear relationship between the number of classes they missed and their final grades. The accompanying table shows these data for a random sample of nine students. Complete parts a through c. Click the icon to view the table...
Missed Classes Final Grade
4 75
6 80
1 91
4 71
0 95
2 83
0 91
5 86
2 96
Suppose a teacher recorded the attendance of her students in a recent statistics class because she wanted to investigate the linear relationship between the number of classes they missed and their final grades. The accompanying table shows these data for a random sample of nine students. Complete parts a through c. Click the icon to view the table...
 In an effort to improve final grades in her class, a professor tried a new method of evaluation with one of her intro stats classes last term. A test of the null hypothesis that her old method (used with one class) and new method (used with her other class) don't differ in the mean final grade for students yielded a p-value of 0.095. Would a 95% confidence interval for Hold-Hnew include 0? Explain your answer
 Well help Two professors at a local college developed a new teaching curriculum designed to increase students' grades in math classes. In a typical developmental math course 56% of the students complete the course with a letter grade of A, B, or C. In the experimental course, of the 17 students enrolled, 13 completed the course with a letter grade of A, B, or C. Is the experimental course effective at the u=0.01 level of significance? Complete parts (a) through...
Most questions answered within 3 hours.
-
Where is the error in this code sequence?
String s1 = "Hello";
String s2 = "ello";...
asked 11 months ago -
Financial data for Joel de Paris, Inc., for last year
follow:
Joel de Paris, Inc.
Balance...
asked 11 months ago -
Consider this reaction:
Al2(SO4)3 (aq)+ BaCl3
(aq) Al2Cl6 (aq)- +
3BaSO4(s) . What is the...
asked 11 months ago -
Suppose that Savneet is considering increasing her
recent random sample from 20 car rentals to 40...
asked 11 months ago -
Trucks arrive at an unloading terminal at an average rate of 120
per hour.
Trucks arrive...
asked 11 months ago -
Why are methanol and ethanol completely soluble in water while
octanol is not very little soluble....
asked 11 months ago -
A facilities manager at a university reads in a research report
that the mean amount of...
asked 11 months ago -
When the CuSO4 is rehydrated by adding water to the anhydrous
compound, is this an endothermic...
asked 11 months ago -
A ray of sunlight is passing from diamond into crown glass; the
angle of incidence is...
asked 11 months ago -
A block of mass 0.249 kg is placed on top of a light, vertical
spring of...
asked 11 months ago -
how do the kidneys compensate in the presences of acidosis
a) trigger hyperventilate
b) reserve acid...
asked 11 months ago -
Question 501 pts
The rental rate of capital to the firm increases. Which of the
following...
asked 11 months ago