
Homework Answers
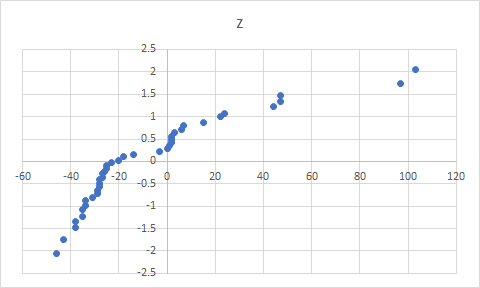
from above normal quantile plot:
option D is correct

Add Answer to:
Sample data for the arrival delay times in minutes) of airlines flights is given below. Determine...
Determining Normality - Select 3 columns of your choice from the list below. For each of the 3 columns you selected, det...
Determining Normality - Select 3 columns of your choice from the list below. For each of the 3 columns you selected, determine whether the data is normally distributed in two ways: 1. Create a Histogram of the data and determine if it is approximately bell-shaped, and 2. Create a Normal Quantile Plot and determine if the pattern of points is reasonably close to a straight line. After examining these two graphs together, decide whether the data is normally distributed and...
Listed below are the amounts of net worth (in millions of dollars) of the ten wealthiest...
Listed below are the amounts of net worth (in millions of dollars) of the ten wealthiest celebrities in a country. Construct a 99% confidence interval. What does the result tell us about the population of all celebrities? Do the data appear to be from a normally distributed population as required? 256 216 196 174 156 150 145 145 145 140 What is the confidence interval estimate of the population mean μ? $_____ million < μ < $_____ (Round to one...
Listed below are the amounts of net worth (in millions of dollars) of the ten wealthiest...
Listed below are the amounts of net worth (in millions of dollars) of the ten wealthiest celebrities in a country. Construct a 95% confidence interval. What does the result tell us about the population of all celebrities? Do the data appear to be from a normally distributed population as required? 254 204 186 161 160 156 154 154 154 149 What is the confidence interval estimate of the population mean mu? $ nothing millionless thanmuless than$ nothing million (Round to...
I celebrities? Do the data appear to be from a normal ctributed nonulation as require worth...
 I celebrities? Do the data appear to be from a normal ctributed nonulation as require worth (in millions of dollars) of the ten wealthiest celebrities in a country. Construct a 95 % confidence interval. What does the result tell us about the population of a 146 146 256 204 187 161 152 150 146 146 What is the confidence interval estimate of the population mean u? smilion <u milion (Round to one decimal place as needed.) What does the result...
Uuestion Hel Use a calculator or computer software to generate a normal quantile plot for the...
 Uuestion Hel Use a calculator or computer software to generate a normal quantile plot for the data in the accompanying table. Then determine whether the data come from a normally distributed population Click the icon to view the data set Generate a normal quantile plot for the data. Choose the correct graph below ОА. OB 3.00 0.00 -100 -200- 3.00 2001 200 100 200 300 400 500 6 100 200 300 400 500 0 100 200 300 400 500 Determine...
Departure Observation with Departure Times Date Departure Delay minutes WA JW, RW 136 Scheduled: 08:00; Actual:...
 Departure Observation with Departure Times Date Departure Delay minutes WA JW, RW 136 Scheduled: 08:00; Actual: 07:541 137 Scheduled: 17:10Actual: 20:301 138 Scheduled 15:45; Act 11:44 139 Schedule: 07:50; Actual: 07:43 140 Scheduled 18:45; Actual: 22:23) 141 Scheduled: 03:50: Actual:09:17 142 Scheduled 12:00; Actual: 11:561 14 Scheduled 11:00; Actual: 10:53 144 Scheduled: 19:55; Actual: 20:19 165 Scheduled 11:00; Actual: 10:56 16h a 19. al 14.20 2007-12-04 2007-12-04 2007-12-04 2007-12-04 2007-12-04 2007-12-05 2007-12-05 2007-12-05 2007-12-05 2007-12-05 2007/12-05 -6 200 3 -7...
Listed below are the amounts of net worth (in millions of dollars) of the ten wealthiest celebrities in a country
Listed below are the amounts of net worth (in millions of dollars) of the ten wealthiest celebrities in a country. Construct a 90% confidence interval. What does the result tell us about the population of all celebrities? Do the data appear to be from a normally distributed population as required? 268 211 186 171 169 156 147 147 147 142 What is the confidence interval estimate of the population mean μ? What does the result tell us about the population of all celebrities? Select...
Listed below are the amounts of net worth (in millions of dollars) of the ten wealthiest celebrities in a country
Listed below are the amounts of net worth (in millions of dollars) of the ten wealthiest celebrities in a country. Construct a 90% confidence interval. What does the result tell us about the population of all celebrities? Do the data appear to be from a normally distributed population as required? 268 211 186 171 169 156 147 147 147 142 What is the confidence interval estimate of the population mean μ? What does the result tell us about the population of all celebrities?...
Option 1 or 2. Option 1: Use the NOAA data set provided, to examine the variable...
 Option 1 or 2.
Option 1: Use the NOAA data set provided, to examine the variable DX32. DX32 represents the number of days in that month whose maximum temperature was less than 32 degrees F. The mean of DX32 during this time period was 3.6. Using Excel, StatCrunch, etc, draw a histogram for DX32. Does this variable have an approximately normal (i.e. bell-shaped) distribution? A normal distribution should have most of its values clustered close to its mean. What kind...
Option 1 or 2.
Option 1: Use the NOAA data set provided, to examine the variable DX32. DX32 represents the number of days in that month whose maximum temperature was less than 32 degrees F. The mean of DX32 during this time period was 3.6. Using Excel, StatCrunch, etc, draw a histogram for DX32. Does this variable have an approximately normal (i.e. bell-shaped) distribution? A normal distribution should have most of its values clustered close to its mean. What kind...
A comparison is made between two bus lines to determine if arrival times of their regular...
 A comparison is made between two bus lines to determine if
arrival times of their regular buses from Denver to Durango are off
schedule by the same amount of time. For 51 randomly selected runs,
bus line A was observed to be off schedule an average time of 53
minutes, with standard deviation 19minutes. For 61 randomly
selected runs, bus line B was observed to be off schedule an
average of 62 minutes, with standard deviation 15 minutes. Do the...
A comparison is made between two bus lines to determine if
arrival times of their regular buses from Denver to Durango are off
schedule by the same amount of time. For 51 randomly selected runs,
bus line A was observed to be off schedule an average time of 53
minutes, with standard deviation 19minutes. For 61 randomly
selected runs, bus line B was observed to be off schedule an
average of 62 minutes, with standard deviation 15 minutes. Do the...
 I celebrities? Do the data appear to be from a normal ctributed nonulation as require worth (in millions of dollars) of the ten wealthiest celebrities in a country. Construct a 95 % confidence interval. What does the result tell us about the population of a 146 146 256 204 187 161 152 150 146 146 What is the confidence interval estimate of the population mean u? smilion <u milion (Round to one decimal place as needed.) What does the result...
 Uuestion Hel Use a calculator or computer software to generate a normal quantile plot for the data in the accompanying table. Then determine whether the data come from a normally distributed population Click the icon to view the data set Generate a normal quantile plot for the data. Choose the correct graph below ОА. OB 3.00 0.00 -100 -200- 3.00 2001 200 100 200 300 400 500 6 100 200 300 400 500 0 100 200 300 400 500 Determine...
 Departure Observation with Departure Times Date Departure Delay minutes WA JW, RW 136 Scheduled: 08:00; Actual: 07:541 137 Scheduled: 17:10Actual: 20:301 138 Scheduled 15:45; Act 11:44 139 Schedule: 07:50; Actual: 07:43 140 Scheduled 18:45; Actual: 22:23) 141 Scheduled: 03:50: Actual:09:17 142 Scheduled 12:00; Actual: 11:561 14 Scheduled 11:00; Actual: 10:53 144 Scheduled: 19:55; Actual: 20:19 165 Scheduled 11:00; Actual: 10:56 16h a 19. al 14.20 2007-12-04 2007-12-04 2007-12-04 2007-12-04 2007-12-04 2007-12-05 2007-12-05 2007-12-05 2007-12-05 2007-12-05 2007/12-05 -6 200 3 -7...
 Option 1 or 2.
Option 1: Use the NOAA data set provided, to examine the variable DX32. DX32 represents the number of days in that month whose maximum temperature was less than 32 degrees F. The mean of DX32 during this time period was 3.6. Using Excel, StatCrunch, etc, draw a histogram for DX32. Does this variable have an approximately normal (i.e. bell-shaped) distribution? A normal distribution should have most of its values clustered close to its mean. What kind...
Option 1 or 2.
Option 1: Use the NOAA data set provided, to examine the variable DX32. DX32 represents the number of days in that month whose maximum temperature was less than 32 degrees F. The mean of DX32 during this time period was 3.6. Using Excel, StatCrunch, etc, draw a histogram for DX32. Does this variable have an approximately normal (i.e. bell-shaped) distribution? A normal distribution should have most of its values clustered close to its mean. What kind...
 A comparison is made between two bus lines to determine if
arrival times of their regular buses from Denver to Durango are off
schedule by the same amount of time. For 51 randomly selected runs,
bus line A was observed to be off schedule an average time of 53
minutes, with standard deviation 19minutes. For 61 randomly
selected runs, bus line B was observed to be off schedule an
average of 62 minutes, with standard deviation 15 minutes. Do the...
A comparison is made between two bus lines to determine if
arrival times of their regular buses from Denver to Durango are off
schedule by the same amount of time. For 51 randomly selected runs,
bus line A was observed to be off schedule an average time of 53
minutes, with standard deviation 19minutes. For 61 randomly
selected runs, bus line B was observed to be off schedule an
average of 62 minutes, with standard deviation 15 minutes. Do the...
Most questions answered within 3 hours.
-
Where is the error in this code sequence?
String s1 = "Hello";
String s2 = "ello";...
asked 10 months ago -
Financial data for Joel de Paris, Inc., for last year
follow:
Joel de Paris, Inc.
Balance...
asked 10 months ago -
Consider this reaction:
Al2(SO4)3 (aq)+ BaCl3
(aq) Al2Cl6 (aq)- +
3BaSO4(s) . What is the...
asked 10 months ago -
Suppose that Savneet is considering increasing her
recent random sample from 20 car rentals to 40...
asked 10 months ago -
Trucks arrive at an unloading terminal at an average rate of 120
per hour.
Trucks arrive...
asked 10 months ago -
Why are methanol and ethanol completely soluble in water while
octanol is not very little soluble....
asked 10 months ago -
A facilities manager at a university reads in a research report
that the mean amount of...
asked 10 months ago -
When the CuSO4 is rehydrated by adding water to the anhydrous
compound, is this an endothermic...
asked 10 months ago -
A ray of sunlight is passing from diamond into crown glass; the
angle of incidence is...
asked 10 months ago -
A block of mass 0.249 kg is placed on top of a light, vertical
spring of...
asked 10 months ago -
how do the kidneys compensate in the presences of acidosis
a) trigger hyperventilate
b) reserve acid...
asked 10 months ago -
Question 501 pts
The rental rate of capital to the firm increases. Which of the
following...
asked 10 months ago