

Homework Answers
Note: Final answers are highlighted in colour.
a)

(i) Forecast for month 2= 0.2* Actual sales for Month 1+ 0.8* Forecasted sales for Month 1
Forecast for Month 1 can be assumed to be equal to Actual sales for Month 1.
Forecast for month 2= 0.2*23 + 0.8 * 23 = 23
(ii)Error = Actual sales volume- Forecasted Volume= 17-23= -6
(iii)Forecast for Month 7=0.2* Actual sales for Month 6+ 0.8* Forecasted sales for Month 6
= 0.2*23 + 0.8 * 19.698= 20.358
MSE= (36+23.04+26.6256+118.2004+10.9032)/5= 42.9538
Final Table
| Month | Units Sold(Thousands) | Forecast(F) | Error | Squared Error |
| 1 | 23 | 23 | 0 | 0 |
| 2 | 17 | 23(i) | -6(ii) | 36 |
| 3 | 17 | 21.8 | -4.8 | 23.04 |
| 4 | 26 | 20.84 | 5.16 | 26.6256 |
| 5 | 11 | 21.872 | -10.872 | 118.2004 |
| 6 | 23 | 19.6976 | 3.3024 | 10.90585 |
| 7 | 20.35808(iii) | -20.3581 | 414.4514 | |
| Alpha | 0.2 | MSE | 42.95437 |
b)
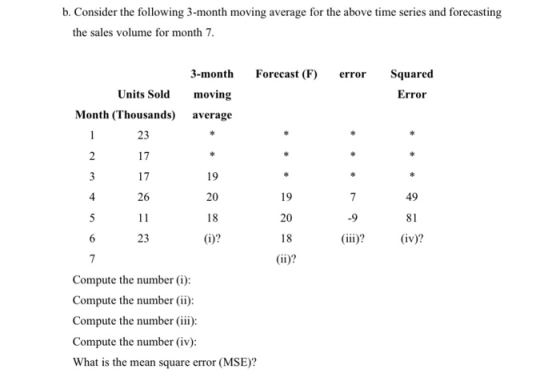
(i) Moving average = (23+11+26)/3= 20
ii) Forecast for Month 7= Moving average of Month 6= 20
iii) Error of month 6= Actual - Forecast= 23-18= 5
iv) Squared error for month 6= (Error of Month 6)^2= 5^2= 25
v) Mean square error(MSE)= Sum of Squared Errors/ n= (49+81+25)/3= 51.67
Final table
| Month | Units Sold(Thousands) | 3 Month moving average | Forecast(F) | Error | Squared Error |
| 1 | 23 | ||||
| 2 | 17 | ||||
| 3 | 17 | 19 | 0 | ||
| 4 | 26 | 20 | 19 | 7 | 49 |
| 5 | 11 | 18 | 20 | -9 | 81 |
| 6 | 23 | 20(i) | 18 | 5(iii) | 25(iv) |
| 7 | 20(ii) | MSE= 51.66667(v) |
Add Answer to:
Question 3 part a & b. please show work!
3. The following time series shows the...
The following time series shows the number of units of a particular product sold over the...
 The following time series shows the number of units of a
particular product sold over the past six months.
a. Use
= 0.2 to compute the exponential smoothing values for the time
series, forecast the sales volume for month 7, and fill in the
unknown spaces.
Compute the number (i):
Compute the number (ii):
Compute the number (iii):
What is the mean square error (MSE)?
b. Consider the following 3-month moving average for the above
time series and forecasting the...
The following time series shows the number of units of a
particular product sold over the past six months.
a. Use
= 0.2 to compute the exponential smoothing values for the time
series, forecast the sales volume for month 7, and fill in the
unknown spaces.
Compute the number (i):
Compute the number (ii):
Compute the number (iii):
What is the mean square error (MSE)?
b. Consider the following 3-month moving average for the above
time series and forecasting the...
Question 2 A-E. 1 Q2. The following time series shows the number of units of a...
 Question 2 A-E.
1 Q2. The following time series shows the number of units of a product sold over the past six months. Units Sold Month (Thousands) 9 2 3 3 6 4 6 5 12 6 9 Consider the following 3-month moving average for the above time series and forecast the sales volume for month 7. Month Units Sold 3-month moving (Thousands) average Forecast (F) error Squared Error 9 * * ذرا * * * * ** 2 3...
Question 2 A-E.
1 Q2. The following time series shows the number of units of a product sold over the past six months. Units Sold Month (Thousands) 9 2 3 3 6 4 6 5 12 6 9 Consider the following 3-month moving average for the above time series and forecast the sales volume for month 7. Month Units Sold 3-month moving (Thousands) average Forecast (F) error Squared Error 9 * * ذرا * * * * ** 2 3...
Based on the time series values from problem number 2, consider the following table of exponential...
Based on the time series values from problem number 2, consider the following table of exponential smoothing values using ? = ?. ? for the time series. Month Units Sold (Thousands) Forecast (F) error Squared error 1 9 * * * 2 3 (i)? (ii)? 36 3 6 7.2000 -1.2000 1.44 4 6 6.8400 -0.8400 0.7056 5 12 6.5880 5.4120 29.2897 6 9 8.2116 0.7884 0.6216 7 (iii)? a) b) c) d) e) a. Compute the number (i): Show your...
Q3. error Based on the time series values from problem number 2, consider the following table...
 Q3. error Based on the time series values from problem number 2, consider the following table of exponential smoothing values using a = 0.3 for the time series. Units Sold Forecast (F) Squared error Month (Thousands) 9 2 3 (0)? (ii)? 36 3 6 7.2000 -1.2000 1.44 4 6 6.8400 -0.8400 0.7056 5 12 6.5880 5.4120 29.2897 6 9 8.2116 0.7884 0.6216 7 (iii)? a) (3pt) Compute the number (i): Show your work for full credit b) (3pt) Compute the...
Q3 A-E Q3. Based on the time series values from problem number 2, consider the following...
 Q3
A-E
Q3. Based on the time series values from problem number 2, consider the following table of exponential smoothing values using a = 0.3 for the time series. Units Sold Forecast (F) error Month (Thousands) Squared error 9 2 3 (i)? (ii)? 36 6 7.2000 -1.2000 1.44 4 6 6.8400 -0.8400 0.7056 5 12 6.5880 5.4120 29.2897 6 9 8.2116 0.7884 0.6216 7 (iii)? 3 a) (3pt) Compute the number (i): Show your work for full credit b) (3pt)...
Q3
A-E
Q3. Based on the time series values from problem number 2, consider the following table of exponential smoothing values using a = 0.3 for the time series. Units Sold Forecast (F) error Month (Thousands) Squared error 9 2 3 (i)? (ii)? 36 6 7.2000 -1.2000 1.44 4 6 6.8400 -0.8400 0.7056 5 12 6.5880 5.4120 29.2897 6 9 8.2116 0.7884 0.6216 7 (iii)? 3 a) (3pt) Compute the number (i): Show your work for full credit b) (3pt)...
Q3 A-E Q3. Based on the time series values from problem number 2, consider the following...
 Q3 A-E
Q3. Based on the time series values from problem number 2, consider the following table of exponential smoothing values using a = 0.3 for the time series. Forecast (F) error Squared error Month Units Sold (Thousands) 9 * 1 2 برا برا 6 6 4 5 (i)? 7.2000 6.8400 6.5880 8.2116 (iii)? (ii)? -1.2000 -0.8400 5.4120 0.7884 36 1.44 0.7056 29.2897 0.6216 12 9 6 7 a) (3pt) Compute the number (i): Show your work for full credit...
Q3 A-E
Q3. Based on the time series values from problem number 2, consider the following table of exponential smoothing values using a = 0.3 for the time series. Forecast (F) error Squared error Month Units Sold (Thousands) 9 * 1 2 برا برا 6 6 4 5 (i)? 7.2000 6.8400 6.5880 8.2116 (iii)? (ii)? -1.2000 -0.8400 5.4120 0.7884 36 1.44 0.7056 29.2897 0.6216 12 9 6 7 a) (3pt) Compute the number (i): Show your work for full credit...
Consider the following time series data. Week 1 2 3 4 5 6 Value 17 13...
 Consider the following time series data.
Week
1
2
3
4
5
6
Value
17
13
15
11
15
13
(a)
Choose the correct time series plot.
(i)
(ii)
(iii)
(iv)
- Select your answer -Graph (i)Graph (ii)Graph (iii)Graph
(iv)Item 1
What type of pattern exists in the data?
- Select your answer -Horizontal PatternTrend PatternItem
2
(b)
Develop a three-week moving average for this time series.
Compute MSE and a forecast for week 7.
If required, round your answers...
Consider the following time series data.
Week
1
2
3
4
5
6
Value
17
13
15
11
15
13
(a)
Choose the correct time series plot.
(i)
(ii)
(iii)
(iv)
- Select your answer -Graph (i)Graph (ii)Graph (iii)Graph
(iv)Item 1
What type of pattern exists in the data?
- Select your answer -Horizontal PatternTrend PatternItem
2
(b)
Develop a three-week moving average for this time series.
Compute MSE and a forecast for week 7.
If required, round your answers...
Omework Consider the following time series data Month 1 2 3 4 5 6 7 Value 21 14 18 13 18 21 14 a....
 omework Consider the following time series data Month 1 2 3 4 5 6 7 Value 21 14 18 13 18 21 14 a. Which of the following is a correct time series plot for this data? や" -Select your answer- What type of pattern exists in the data? -select your answer- b. Develop the three-month moving average forecasts for this time series. Compute MSE and a forecast for month 8 (to 2 decimals if necessary). Enter negative values as...
- + Fit to page ID Page view A) Read alouc * Q3. Based on the...
 - + Fit to page ID Page view A) Read alouc * Q3. Based on the time series values from problem number 2, consider the following table of exponential smoothing values using a = 0.3 for the time series. Units Sold Forecast (F) error Month (Thousands) Squared error 9 2 3 (i)? (ii)? 36 3 6 7.2000 -1.2000 1.44 4 6 6.8400 -0.8400 0.7056 5 12 6.5880 5.4120 29.2897 6 9 8.2116 0.7884 0.6216 (iii)? 1 7 a) (3pt) Compute...
Consider the following time series data. Month Value 1 21 2 3 4 14 2014 5...
 Consider the following time series data. Month Value 1 21 2 3 4 14 2014 5 18 6 21 7 15 Round your answers to two decimal places. a. Compute MSE using the most recent value as the forecast for the next period. Mean squared error is What is the forecast for month 8? b. Compute MSE using the average of all data available as the forecast for the next period Mean squared error is What is the forecast for...
 The following time series shows the number of units of a
particular product sold over the past six months.
a. Use
= 0.2 to compute the exponential smoothing values for the time
series, forecast the sales volume for month 7, and fill in the
unknown spaces.
Compute the number (i):
Compute the number (ii):
Compute the number (iii):
What is the mean square error (MSE)?
b. Consider the following 3-month moving average for the above
time series and forecasting the...
The following time series shows the number of units of a
particular product sold over the past six months.
a. Use
= 0.2 to compute the exponential smoothing values for the time
series, forecast the sales volume for month 7, and fill in the
unknown spaces.
Compute the number (i):
Compute the number (ii):
Compute the number (iii):
What is the mean square error (MSE)?
b. Consider the following 3-month moving average for the above
time series and forecasting the...
 Question 2 A-E.
1 Q2. The following time series shows the number of units of a product sold over the past six months. Units Sold Month (Thousands) 9 2 3 3 6 4 6 5 12 6 9 Consider the following 3-month moving average for the above time series and forecast the sales volume for month 7. Month Units Sold 3-month moving (Thousands) average Forecast (F) error Squared Error 9 * * ذرا * * * * ** 2 3...
Question 2 A-E.
1 Q2. The following time series shows the number of units of a product sold over the past six months. Units Sold Month (Thousands) 9 2 3 3 6 4 6 5 12 6 9 Consider the following 3-month moving average for the above time series and forecast the sales volume for month 7. Month Units Sold 3-month moving (Thousands) average Forecast (F) error Squared Error 9 * * ذرا * * * * ** 2 3...
 Q3. error Based on the time series values from problem number 2, consider the following table of exponential smoothing values using a = 0.3 for the time series. Units Sold Forecast (F) Squared error Month (Thousands) 9 2 3 (0)? (ii)? 36 3 6 7.2000 -1.2000 1.44 4 6 6.8400 -0.8400 0.7056 5 12 6.5880 5.4120 29.2897 6 9 8.2116 0.7884 0.6216 7 (iii)? a) (3pt) Compute the number (i): Show your work for full credit b) (3pt) Compute the...
 Q3
A-E
Q3. Based on the time series values from problem number 2, consider the following table of exponential smoothing values using a = 0.3 for the time series. Units Sold Forecast (F) error Month (Thousands) Squared error 9 2 3 (i)? (ii)? 36 6 7.2000 -1.2000 1.44 4 6 6.8400 -0.8400 0.7056 5 12 6.5880 5.4120 29.2897 6 9 8.2116 0.7884 0.6216 7 (iii)? 3 a) (3pt) Compute the number (i): Show your work for full credit b) (3pt)...
Q3
A-E
Q3. Based on the time series values from problem number 2, consider the following table of exponential smoothing values using a = 0.3 for the time series. Units Sold Forecast (F) error Month (Thousands) Squared error 9 2 3 (i)? (ii)? 36 6 7.2000 -1.2000 1.44 4 6 6.8400 -0.8400 0.7056 5 12 6.5880 5.4120 29.2897 6 9 8.2116 0.7884 0.6216 7 (iii)? 3 a) (3pt) Compute the number (i): Show your work for full credit b) (3pt)...
 Q3 A-E
Q3. Based on the time series values from problem number 2, consider the following table of exponential smoothing values using a = 0.3 for the time series. Forecast (F) error Squared error Month Units Sold (Thousands) 9 * 1 2 برا برا 6 6 4 5 (i)? 7.2000 6.8400 6.5880 8.2116 (iii)? (ii)? -1.2000 -0.8400 5.4120 0.7884 36 1.44 0.7056 29.2897 0.6216 12 9 6 7 a) (3pt) Compute the number (i): Show your work for full credit...
Q3 A-E
Q3. Based on the time series values from problem number 2, consider the following table of exponential smoothing values using a = 0.3 for the time series. Forecast (F) error Squared error Month Units Sold (Thousands) 9 * 1 2 برا برا 6 6 4 5 (i)? 7.2000 6.8400 6.5880 8.2116 (iii)? (ii)? -1.2000 -0.8400 5.4120 0.7884 36 1.44 0.7056 29.2897 0.6216 12 9 6 7 a) (3pt) Compute the number (i): Show your work for full credit...
 Consider the following time series data.
Week
1
2
3
4
5
6
Value
17
13
15
11
15
13
(a)
Choose the correct time series plot.
(i)
(ii)
(iii)
(iv)
- Select your answer -Graph (i)Graph (ii)Graph (iii)Graph
(iv)Item 1
What type of pattern exists in the data?
- Select your answer -Horizontal PatternTrend PatternItem
2
(b)
Develop a three-week moving average for this time series.
Compute MSE and a forecast for week 7.
If required, round your answers...
Consider the following time series data.
Week
1
2
3
4
5
6
Value
17
13
15
11
15
13
(a)
Choose the correct time series plot.
(i)
(ii)
(iii)
(iv)
- Select your answer -Graph (i)Graph (ii)Graph (iii)Graph
(iv)Item 1
What type of pattern exists in the data?
- Select your answer -Horizontal PatternTrend PatternItem
2
(b)
Develop a three-week moving average for this time series.
Compute MSE and a forecast for week 7.
If required, round your answers...
 omework Consider the following time series data Month 1 2 3 4 5 6 7 Value 21 14 18 13 18 21 14 a. Which of the following is a correct time series plot for this data? や" -Select your answer- What type of pattern exists in the data? -select your answer- b. Develop the three-month moving average forecasts for this time series. Compute MSE and a forecast for month 8 (to 2 decimals if necessary). Enter negative values as...
 - + Fit to page ID Page view A) Read alouc * Q3. Based on the time series values from problem number 2, consider the following table of exponential smoothing values using a = 0.3 for the time series. Units Sold Forecast (F) error Month (Thousands) Squared error 9 2 3 (i)? (ii)? 36 3 6 7.2000 -1.2000 1.44 4 6 6.8400 -0.8400 0.7056 5 12 6.5880 5.4120 29.2897 6 9 8.2116 0.7884 0.6216 (iii)? 1 7 a) (3pt) Compute...
 Consider the following time series data. Month Value 1 21 2 3 4 14 2014 5 18 6 21 7 15 Round your answers to two decimal places. a. Compute MSE using the most recent value as the forecast for the next period. Mean squared error is What is the forecast for month 8? b. Compute MSE using the average of all data available as the forecast for the next period Mean squared error is What is the forecast for...
Most questions answered within 3 hours.
-
Where is the error in this code sequence?
String s1 = "Hello";
String s2 = "ello";...
asked 10 months ago -
Financial data for Joel de Paris, Inc., for last year
follow:
Joel de Paris, Inc.
Balance...
asked 10 months ago -
Consider this reaction:
Al2(SO4)3 (aq)+ BaCl3
(aq) Al2Cl6 (aq)- +
3BaSO4(s) . What is the...
asked 10 months ago -
Suppose that Savneet is considering increasing her
recent random sample from 20 car rentals to 40...
asked 10 months ago -
Trucks arrive at an unloading terminal at an average rate of 120
per hour.
Trucks arrive...
asked 10 months ago -
Why are methanol and ethanol completely soluble in water while
octanol is not very little soluble....
asked 10 months ago -
A facilities manager at a university reads in a research report
that the mean amount of...
asked 10 months ago -
When the CuSO4 is rehydrated by adding water to the anhydrous
compound, is this an endothermic...
asked 10 months ago -
A ray of sunlight is passing from diamond into crown glass; the
angle of incidence is...
asked 10 months ago -
A block of mass 0.249 kg is placed on top of a light, vertical
spring of...
asked 10 months ago -
how do the kidneys compensate in the presences of acidosis
a) trigger hyperventilate
b) reserve acid...
asked 10 months ago -
Question 501 pts
The rental rate of capital to the firm increases. Which of the
following...
asked 10 months ago