
Homework Answers


Add Answer to:
3) Find the test statistics x2 for the indicated goodness-of-fit test. (Do not write out the...
3) Find the test statistics x2 for the indicated goodness-of-fit test. (Do not write out the...
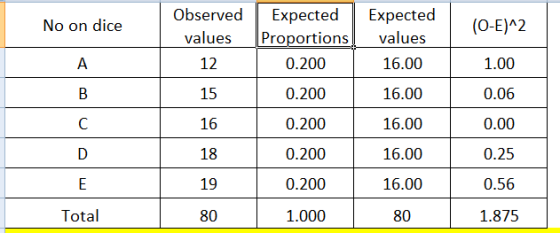
 3) Find the test statistics x2 for the indicated goodness-of-fit test. (Do not write out the entire test) 3) Using the data below and a 0.05 significance level, test the claim that the responses occur with percentages of 15%, 20%, 25%, 25%, and 15% respectively. Response A B C D E Frequency 12 15 16 18 19 Fill out the table below and use it to find the test statistics x2. (0-E2 E 0 E O-E (0-E)2 +2=
3) Find the test statistics x2 for the indicated goodness-of-fit test. (Do not write out the...
 3) Find the test statistics x2 for the indicated goodness-of-fit test. (Do not write out the entire test) 3) Using the data below and a 0.05 significance level, test the claim that the responses occur with percentages of 15%, 20%, 25%, 25%, and 15% respectively. Response A B C D E Frequency 12 15 16 18 19 Fill out the table below and use it to find the test statistics x2. (0-E) E 0 E O-E (0-E) x2 = given...
1. Perform the indicated goodness-of-fit test. Using the data below and a 0.05 significance level, test the claim that...
 1. Perform the indicated goodness-of-fit
test.
Using the data below and a 0.05 significance level, test the claim
that the responses occur with percentages of 15%, 20%, 25%, 25%,
and 15% respectively.
a. test statistic
b. critical value
2.Perform the indicated goodness-of-fit
test.
In studying the responses to a multiple-choice test question, the
following sample data were obtained. At the 0.05 significance
level, test the claim that the responses occur with the same
frequency.
a. test statistic
b. critical value
1. Perform the indicated goodness-of-fit
test.
Using the data below and a 0.05 significance level, test the claim
that the responses occur with percentages of 15%, 20%, 25%, 25%,
and 15% respectively.
a. test statistic
b. critical value
2.Perform the indicated goodness-of-fit
test.
In studying the responses to a multiple-choice test question, the
following sample data were obtained. At the 0.05 significance
level, test the claim that the responses occur with the same
frequency.
a. test statistic
b. critical value
1. Perform the indicated goodness-of-fit test. A company manager wishes to test a union leader's claim...
 1. Perform the indicated goodness-of-fit
test.
A company manager wishes to test a union leader's claim that
absences occur on the different week days with the same
frequencies. Test this claim at the 0.05 level of significance if
the following sample data have been compiled.
a. test statistic
b. critical value
2.Perform the indicated goodness-of-fit
test.
In studying the responses to a multiple-choice test question, the
following sample data were obtained. At the 0.05 significance
level, test the claim that...
1. Perform the indicated goodness-of-fit
test.
A company manager wishes to test a union leader's claim that
absences occur on the different week days with the same
frequencies. Test this claim at the 0.05 level of significance if
the following sample data have been compiled.
a. test statistic
b. critical value
2.Perform the indicated goodness-of-fit
test.
In studying the responses to a multiple-choice test question, the
following sample data were obtained. At the 0.05 significance
level, test the claim that...
Perform the indicated goodness-of-fit test. Fill in the table below to find the test statistic. 9)...
 Perform the indicated goodness-of-fit test. Fill in the table below to find the test statistic. 9) In studying the responses to a multiple-choice test question, the following sample data were obtained. At the 0.05 significance level, test the claim that the responses occur with the same frequency A. Classical method with Chi-square statistic (0-E) (0-E)^2 [(O-E)^2]/E Response A B C D E Frequency 12 15 16 18 19 RESPONSE o E A 12 В 15 16 C 16 D 18...
Goodness of Fit Test Perform the Goodness-of-Fit Test 1) Perform the indicated goodness-of-fit test. A company...
 Goodness of Fit Test Perform the Goodness-of-Fit Test 1) Perform the indicated goodness-of-fit test. A company manager wishes to test a union leader's claim that absences occur on the different week days with the same frequencies. Test this claim at the 0.05 level of significance if the following sample data have been compiled. Day Mon Tue Wed Thurs Fri Absences 37 15 12 23 43 Step 1: Ho: H Step 2: Significance level is Step 3: Test Statistics Step 4:...
1. Perform the indicated goodness-of-fit test. Use a significance level of 0.01 to test the claim...
 1. Perform the indicated goodness-of-fit
test.
Use a significance level of 0.01 to test the claim that workplace
accidents are distributed on workdays as follows: Monday 25%,
Tuesday: 15%, Wednesday: 15%, Thursday: 15%, and Friday: 30%.
In a study of 100 workplace accidents, 26 occurred on a Monday, 15
occurred on a Tuesday, 17 occurred on a Wednesday, 17 occurred on a
Thursday, and 25 occurred on a Friday.
a. test statistic.
b. critical value
2. Perform the indicated goodness-of-fit...
1. Perform the indicated goodness-of-fit
test.
Use a significance level of 0.01 to test the claim that workplace
accidents are distributed on workdays as follows: Monday 25%,
Tuesday: 15%, Wednesday: 15%, Thursday: 15%, and Friday: 30%.
In a study of 100 workplace accidents, 26 occurred on a Monday, 15
occurred on a Tuesday, 17 occurred on a Wednesday, 17 occurred on a
Thursday, and 25 occurred on a Friday.
a. test statistic.
b. critical value
2. Perform the indicated goodness-of-fit...
Perform the indicated goodness-of-fit test. You roll a die 48 times with the following results. a....
 Perform the indicated goodness-of-fit
test.
You roll a die 48 times with the following results.
a. test statistic
b. critical value
Use a significance level of 0.05 to test the claim that the die is
fair.
Perform the indicated goodness-of-fit
test.
You roll a die 48 times with the following results.
a. test statistic
b. critical value
Use a significance level of 0.05 to test the claim that the die is
fair.
Using the GOODNESS OF FIT TEST, Calculate x2. Use a 0.05 level of significance to test...
Using the GOODNESS OF FIT TEST, Calculate x2. Use a 0.05 level of significance to test the claim that the age distribution of the Canadian population fits the age distribution of Red Lake Village. The age distribution of Red Lake is based on a random sample of 455 residences. Age Percent of Canadian Population Observed Number in Red Lake Under 5 8% 48 5 to 14 12% 74 15 to 64 65% 287 64 and up 15% 46 Which is...
 3) Find the test statistics x2 for the indicated goodness-of-fit test. (Do not write out the entire test) 3) Using the data below and a 0.05 significance level, test the claim that the responses occur with percentages of 15%, 20%, 25%, 25%, and 15% respectively. Response A B C D E Frequency 12 15 16 18 19 Fill out the table below and use it to find the test statistics x2. (0-E2 E 0 E O-E (0-E)2 +2=
 3) Find the test statistics x2 for the indicated goodness-of-fit test. (Do not write out the entire test) 3) Using the data below and a 0.05 significance level, test the claim that the responses occur with percentages of 15%, 20%, 25%, 25%, and 15% respectively. Response A B C D E Frequency 12 15 16 18 19 Fill out the table below and use it to find the test statistics x2. (0-E2 E 0 E O-E (0-E)2 +2=
 3) Find the test statistics x2 for the indicated goodness-of-fit test. (Do not write out the entire test) 3) Using the data below and a 0.05 significance level, test the claim that the responses occur with percentages of 15%, 20%, 25%, 25%, and 15% respectively. Response A B C D E Frequency 12 15 16 18 19 Fill out the table below and use it to find the test statistics x2. (0-E) E 0 E O-E (0-E) x2 = given...
 1. Perform the indicated goodness-of-fit
test.
Using the data below and a 0.05 significance level, test the claim
that the responses occur with percentages of 15%, 20%, 25%, 25%,
and 15% respectively.
a. test statistic
b. critical value
2.Perform the indicated goodness-of-fit
test.
In studying the responses to a multiple-choice test question, the
following sample data were obtained. At the 0.05 significance
level, test the claim that the responses occur with the same
frequency.
a. test statistic
b. critical value
1. Perform the indicated goodness-of-fit
test.
Using the data below and a 0.05 significance level, test the claim
that the responses occur with percentages of 15%, 20%, 25%, 25%,
and 15% respectively.
a. test statistic
b. critical value
2.Perform the indicated goodness-of-fit
test.
In studying the responses to a multiple-choice test question, the
following sample data were obtained. At the 0.05 significance
level, test the claim that the responses occur with the same
frequency.
a. test statistic
b. critical value
 1. Perform the indicated goodness-of-fit
test.
A company manager wishes to test a union leader's claim that
absences occur on the different week days with the same
frequencies. Test this claim at the 0.05 level of significance if
the following sample data have been compiled.
a. test statistic
b. critical value
2.Perform the indicated goodness-of-fit
test.
In studying the responses to a multiple-choice test question, the
following sample data were obtained. At the 0.05 significance
level, test the claim that...
1. Perform the indicated goodness-of-fit
test.
A company manager wishes to test a union leader's claim that
absences occur on the different week days with the same
frequencies. Test this claim at the 0.05 level of significance if
the following sample data have been compiled.
a. test statistic
b. critical value
2.Perform the indicated goodness-of-fit
test.
In studying the responses to a multiple-choice test question, the
following sample data were obtained. At the 0.05 significance
level, test the claim that...
 Perform the indicated goodness-of-fit test. Fill in the table below to find the test statistic. 9) In studying the responses to a multiple-choice test question, the following sample data were obtained. At the 0.05 significance level, test the claim that the responses occur with the same frequency A. Classical method with Chi-square statistic (0-E) (0-E)^2 [(O-E)^2]/E Response A B C D E Frequency 12 15 16 18 19 RESPONSE o E A 12 В 15 16 C 16 D 18...
 Goodness of Fit Test Perform the Goodness-of-Fit Test 1) Perform the indicated goodness-of-fit test. A company manager wishes to test a union leader's claim that absences occur on the different week days with the same frequencies. Test this claim at the 0.05 level of significance if the following sample data have been compiled. Day Mon Tue Wed Thurs Fri Absences 37 15 12 23 43 Step 1: Ho: H Step 2: Significance level is Step 3: Test Statistics Step 4:...
 1. Perform the indicated goodness-of-fit
test.
Use a significance level of 0.01 to test the claim that workplace
accidents are distributed on workdays as follows: Monday 25%,
Tuesday: 15%, Wednesday: 15%, Thursday: 15%, and Friday: 30%.
In a study of 100 workplace accidents, 26 occurred on a Monday, 15
occurred on a Tuesday, 17 occurred on a Wednesday, 17 occurred on a
Thursday, and 25 occurred on a Friday.
a. test statistic.
b. critical value
2. Perform the indicated goodness-of-fit...
1. Perform the indicated goodness-of-fit
test.
Use a significance level of 0.01 to test the claim that workplace
accidents are distributed on workdays as follows: Monday 25%,
Tuesday: 15%, Wednesday: 15%, Thursday: 15%, and Friday: 30%.
In a study of 100 workplace accidents, 26 occurred on a Monday, 15
occurred on a Tuesday, 17 occurred on a Wednesday, 17 occurred on a
Thursday, and 25 occurred on a Friday.
a. test statistic.
b. critical value
2. Perform the indicated goodness-of-fit...
 Perform the indicated goodness-of-fit
test.
You roll a die 48 times with the following results.
a. test statistic
b. critical value
Use a significance level of 0.05 to test the claim that the die is
fair.
Perform the indicated goodness-of-fit
test.
You roll a die 48 times with the following results.
a. test statistic
b. critical value
Use a significance level of 0.05 to test the claim that the die is
fair.
Most questions answered within 3 hours.
-
Where is the error in this code sequence?
String s1 = "Hello";
String s2 = "ello";...
asked 10 months ago -
Financial data for Joel de Paris, Inc., for last year
follow:
Joel de Paris, Inc.
Balance...
asked 10 months ago -
Consider this reaction:
Al2(SO4)3 (aq)+ BaCl3
(aq) Al2Cl6 (aq)- +
3BaSO4(s) . What is the...
asked 10 months ago -
Suppose that Savneet is considering increasing her
recent random sample from 20 car rentals to 40...
asked 10 months ago -
Trucks arrive at an unloading terminal at an average rate of 120
per hour.
Trucks arrive...
asked 10 months ago -
Why are methanol and ethanol completely soluble in water while
octanol is not very little soluble....
asked 10 months ago -
A facilities manager at a university reads in a research report
that the mean amount of...
asked 10 months ago -
When the CuSO4 is rehydrated by adding water to the anhydrous
compound, is this an endothermic...
asked 10 months ago -
A ray of sunlight is passing from diamond into crown glass; the
angle of incidence is...
asked 10 months ago -
A block of mass 0.249 kg is placed on top of a light, vertical
spring of...
asked 10 months ago -
how do the kidneys compensate in the presences of acidosis
a) trigger hyperventilate
b) reserve acid...
asked 10 months ago -
Question 501 pts
The rental rate of capital to the firm increases. Which of the
following...
asked 10 months ago