

Homework Answers
Answer 38:
Naive forecast value for the current month (i.e., April) = Actual Value for the Previous Month (i.e., March)
= $ 74.80 K (Option 1)
Answer 39:
Let,
At = Actual Value for the Month 't'
Then,
Ft = Forecast value using the three months simple moving averages method = (At-1 + At-2 + At-3 ) / 4
= (74.8 + 72.3 + 71.7) / 3
= $ 72.93 K (Option 2)
Answer 40:
Let,
At-1 = Actual income for the previous month
Ft-1 = Forecast income for the previous month
α = Alpha = 0.1 (As given in the question)
Ft = Simple exponential smoothing forecast for the current month = Ft-1 + α (At-1 - Ft-1)
Note: As no specific information is mentioned in the question for the forecast value of the first month (i.e., Oct), we assume it the same as the actual value of that month = 69.3 K
Thus, we get:

Calculations:

Hence, the correct answer to the given question = Option 5
Answer 41:
Step 1: Find the mean values for both the variables:

Where x = Independent Variable = No. of a particular month and y = Dependent Variable = Income ($ K)

Step 2: Find the three columns as mentioned below:

Where,
xy = x * y
x2 = x * x
y2 = y * y
Step 3: Find the value of byx:

Step 4: Find the linear trend equation:
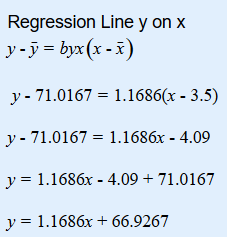
Step 5:
Now, take x = 7 in the linear trend equation as obtained in the previous step:
∴ y = 1.1686 (7) + 66.9267
= $ 75.11 K (Rounded to 2 decimal places) (Option 4)
(Kindly raise an upvote for this answer, if you found it useful)
Add Answer to:
QUESTION 38 Monthly income, in thousands of dollars (5K), at the Acme Law Firm for the...
QUESTION 38 Monthly income, in thousands of dollars (SK), at the Acme Law Firm for the...
 QUESTION 38 Monthly income, in thousands of dollars (SK), at the Acme Law Firm for the six-month period from October to March is listed in the table below. month income, $K Oct 69.3 Nov 68.6 Dec 69.4 Jan 71.7 Feb 72.3 Mar 74.8 According to the regression analysis performed for part 41. what is the numerical value of the strength of the linear association between monthly income and month number Round to four (4) decimal places) 0.3587 0.36 1.16 0.1413...
Monthly income, in thousands of dollars ($K), at the Acme Law Firm for the six-month period...
Monthly income, in thousands of dollars ($K), at the Acme Law Firm for the six-month period from October to March is listed in the table below. month income, $K Oct 69.3 Nov 68.6 Dec 69.4 Jan 71.7 Feb 72.3 Mar 74.8 -what is the simple exponential smoothing forecast with α = 0.1 for monthly income for April? -what is the regression forecast for monthly income for April? -what is the numerical value of the strength of the linear association between monthly...
The monthly sales for Yazici Batteries, Inc., were as follows: Month Sept Oct Nov Dec Sales...
The monthly sales for Yazici Batteries, Inc., were as follows: Month Sept Oct Nov Dec Sales 20 21 23 24 a) Compute the January sales forecast using a trend projection. Using a method of trend projection, the forecast for January Sales is __________. (Round your response to two decimal places.) b) The regression equation is _______________. The average Sales increase per month is __________. c) Using a method of trend projection, the forecast for April is _______. (Round your...
The monthly sales for Yazici Batteries, Inc., were as follows:
The monthly sales for Yazici Batteries, Inc., were as follows: Month Jan Feb Mar Apr May Jun Jul Aug Sept Oct Nov DecSales 19 21 17 14 11 18 16 19 20 20 23 23b) The forecast for the next month (Jan) using the naive method (round your response to a whole number)The forecast for the next period (Jan) using a 3-month moving average approach =(round your response to two decimal places)The forecast for the next period (Jan) using a 6-month weighted average with weights ofandwhere the heaviest weights are applied to the most recent month = (round your response to one decimalplace)Using...
please answer part 2 of C Storrs Cycles has just started selling the new Cyclone mountain...
 please answer part 2 of C
Storrs Cycles has just started selling the new Cyclone mountain bike, with monthly sales as shown in the table. Month Sales Jan 400 Feb 380 Mar 414 Apr 365 a) Based on the given monthly sales data, it can be said that there is not a strong linear trend in sales over time. b) First, co-owner Bob Day wants to forecast by exponential smoothing by initially setting February's forecast equal to January's sales with...
please answer part 2 of C
Storrs Cycles has just started selling the new Cyclone mountain bike, with monthly sales as shown in the table. Month Sales Jan 400 Feb 380 Mar 414 Apr 365 a) Based on the given monthly sales data, it can be said that there is not a strong linear trend in sales over time. b) First, co-owner Bob Day wants to forecast by exponential smoothing by initially setting February's forecast equal to January's sales with...
The monthly sales for Yazici Batteries, Inc., were as follows:
The monthly sales for Yazici Batteries, Inc., were as follows:MonthJanFebMarAprMayJunJulAugSeptOctNovDecSales202115121518151922212124This exercise contains only parts b and c. b) The forecast for the next month (Jan) using the naive method = _______ sales (round your response to a whole number) The forecast for the next period (Jan) using a 3-month moving average approach = _______ sales (round your response to two decimal places) The forecast for the next period (Jan) using a 6-month weighted average with weights of 0.10, 0.10, 0.10, 0.20,0.20, and 0.30,...
Historical demand for a product is as follows: DEMAND April 59 May 54 June 74 July...
Historical demand for a product is as follows: DEMAND April 59 May 54 June 74 July 59 August 79 September 74 a. Using a simple four-month moving average, calculate a forecast for October. (Round your answer to 2 decimal places.) Forecast for October b. Using single exponential smoothing with α = 0.30 and a September forecast = 64, calculate a forecast for October. (Round your answer to 2 decimal places.) Forecast for October c. Using simple linear regression,...
Please help. Im stuck on the exponential smoothing part of this problem. Here are the actual...
Please help. Im stuck on the exponential smoothing part of this problem. Here are the actual tabulated demands for an item for a nine-month period (January through September). Your supervisor wants to test two forecasting methods to see which method was better over this period. MONTH ACTUAL January 110 February 130 March 150 April 170 May 160 June 180 July 140 August 130 September 140 a. Forecast April through September using a three-month moving average. (Round your answers to 1...
Please answer part 2 of B Storrs Cycles has just started selling the new Cyclone mountain...
 Please answer part 2 of B
Storrs Cycles has just started selling the new Cyclone mountain bike, with monthly sales as shown in the table. Month Sales Jan 407 Feb 372 Mar 410 Apr 370 a) Based on the given monthly sales data, it can be said that there is not a strong linear trend in sales over time. b) First, co-owner Bob Day wants to forecast by exponential smoothing by initially setting February's forecast equal to January's sales with...
Please answer part 2 of B
Storrs Cycles has just started selling the new Cyclone mountain bike, with monthly sales as shown in the table. Month Sales Jan 407 Feb 372 Mar 410 Apr 370 a) Based on the given monthly sales data, it can be said that there is not a strong linear trend in sales over time. b) First, co-owner Bob Day wants to forecast by exponential smoothing by initially setting February's forecast equal to January's sales with...
QUESTION 38 Table 1 The following information is provided for Tony Romo's income and expenditures Quantity...
 QUESTION 38 Table 1 The following information is provided for Tony Romo's income and expenditures Quantity Purchased Per Month Monthly Income $2,000 $3,000 Steaks Pizzas 4 In TABLE 1, Tony's income elasticity of demand for steaks is: 1.0 Greater than 1.0 Less than 1.0 Zero QUESTION 39 In TABLE 1, pizzas are classified as a (n): Normal good Positive good Inferior goods Marginal good
 QUESTION 38 Monthly income, in thousands of dollars (SK), at the Acme Law Firm for the six-month period from October to March is listed in the table below. month income, $K Oct 69.3 Nov 68.6 Dec 69.4 Jan 71.7 Feb 72.3 Mar 74.8 According to the regression analysis performed for part 41. what is the numerical value of the strength of the linear association between monthly income and month number Round to four (4) decimal places) 0.3587 0.36 1.16 0.1413...
 please answer part 2 of C
Storrs Cycles has just started selling the new Cyclone mountain bike, with monthly sales as shown in the table. Month Sales Jan 400 Feb 380 Mar 414 Apr 365 a) Based on the given monthly sales data, it can be said that there is not a strong linear trend in sales over time. b) First, co-owner Bob Day wants to forecast by exponential smoothing by initially setting February's forecast equal to January's sales with...
please answer part 2 of C
Storrs Cycles has just started selling the new Cyclone mountain bike, with monthly sales as shown in the table. Month Sales Jan 400 Feb 380 Mar 414 Apr 365 a) Based on the given monthly sales data, it can be said that there is not a strong linear trend in sales over time. b) First, co-owner Bob Day wants to forecast by exponential smoothing by initially setting February's forecast equal to January's sales with...
 Please answer part 2 of B
Storrs Cycles has just started selling the new Cyclone mountain bike, with monthly sales as shown in the table. Month Sales Jan 407 Feb 372 Mar 410 Apr 370 a) Based on the given monthly sales data, it can be said that there is not a strong linear trend in sales over time. b) First, co-owner Bob Day wants to forecast by exponential smoothing by initially setting February's forecast equal to January's sales with...
Please answer part 2 of B
Storrs Cycles has just started selling the new Cyclone mountain bike, with monthly sales as shown in the table. Month Sales Jan 407 Feb 372 Mar 410 Apr 370 a) Based on the given monthly sales data, it can be said that there is not a strong linear trend in sales over time. b) First, co-owner Bob Day wants to forecast by exponential smoothing by initially setting February's forecast equal to January's sales with...
 QUESTION 38 Table 1 The following information is provided for Tony Romo's income and expenditures Quantity Purchased Per Month Monthly Income $2,000 $3,000 Steaks Pizzas 4 In TABLE 1, Tony's income elasticity of demand for steaks is: 1.0 Greater than 1.0 Less than 1.0 Zero QUESTION 39 In TABLE 1, pizzas are classified as a (n): Normal good Positive good Inferior goods Marginal good
Most questions answered within 3 hours.
-
Where is the error in this code sequence?
String s1 = "Hello";
String s2 = "ello";...
asked 10 months ago -
Financial data for Joel de Paris, Inc., for last year
follow:
Joel de Paris, Inc.
Balance...
asked 10 months ago -
Consider this reaction:
Al2(SO4)3 (aq)+ BaCl3
(aq) Al2Cl6 (aq)- +
3BaSO4(s) . What is the...
asked 10 months ago -
Suppose that Savneet is considering increasing her
recent random sample from 20 car rentals to 40...
asked 10 months ago -
Trucks arrive at an unloading terminal at an average rate of 120
per hour.
Trucks arrive...
asked 10 months ago -
Why are methanol and ethanol completely soluble in water while
octanol is not very little soluble....
asked 10 months ago -
A facilities manager at a university reads in a research report
that the mean amount of...
asked 10 months ago -
When the CuSO4 is rehydrated by adding water to the anhydrous
compound, is this an endothermic...
asked 10 months ago -
A ray of sunlight is passing from diamond into crown glass; the
angle of incidence is...
asked 10 months ago -
A block of mass 0.249 kg is placed on top of a light, vertical
spring of...
asked 10 months ago -
how do the kidneys compensate in the presences of acidosis
a) trigger hyperventilate
b) reserve acid...
asked 10 months ago -
Question 501 pts
The rental rate of capital to the firm increases. Which of the
following...
asked 10 months ago