
Homework Answers
Add Answer to:
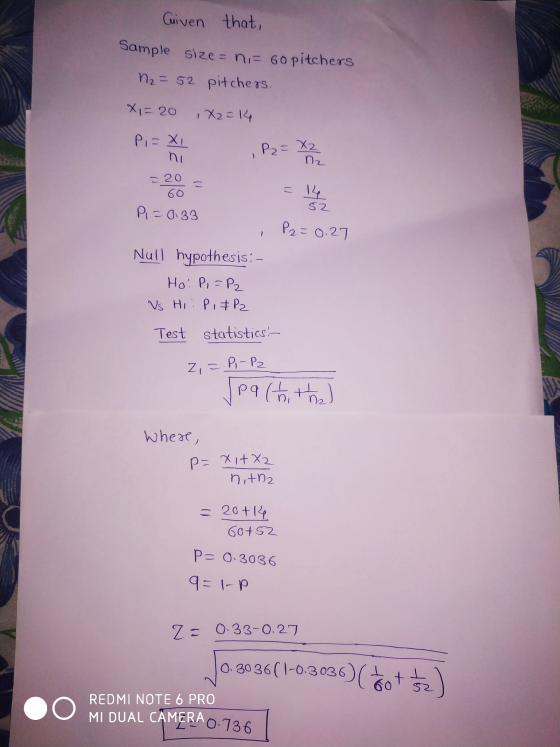
A random sampling of sixty pitchers from the National League and fifty-two pitchers from the American...
Assume that you plan to use a significance level of α = 0.05 to test the...
Assume that you plan to use a significance level of α = 0.05 to test the claim that p1 = p2. Use the given sample sizes and numbers of successes to find the z test statistic for the hypothesis test. In a vote on the Clean Water bill, 48% of the 205 Democrats voted for the bill while 50% of the 230 Republicans voted for it. z = -0.459 z = -0.417 z = -0.354 z = -0.250
Assume that you plan to use a significance level of a = 0.05 to test the...
 Assume that you plan to use a significance level of a = 0.05 to test the claim that p1 - P2. Use the given sample sizes and numbers of successes to find the z test statistic for the hypothesis test. 21) In a vote on the Clean Water bill, 46% of the 205 Democrats voted for the bill while 47% of 21) the 230 Republicans voted for it. hun Identify the null hypothesis, alternative hypothesis, test statistic, P-value, conclusion about...
3) American League baseball teams play their games with the designated hitter rule, meaning that pitchers...
 3) American League baseball teams play their games with the designated hitter rule, meaning that pitchers do not bat. The league believes that replacing the pitcher, typically a weak hitter, with another player in the batting order produces more runs. Using a significance level of a = 0.05, determine if the average number of runs is higher for the American League Following are the average number of runs scored by each team in the 2016 season: American League National League...
Assume that you plan to use a significance level of α = 0.05 to test the...
Assume that you plan to use a significance level of α = 0.05 to test the claim that p1 = p2. Use the given sample sizes and numbers of successes to find the P-value for the hypothesis test. n1 = 50 x1 = 8 n2 = 50 x2 = 7
Independent random samples were selected from two binomial populations, with sample sizes and the number of...
 Independent random samples were selected from two binomial populations, with sample sizes and the number of successes given below. Population 1 2 500 500 119 148 Sample Size Number of Successes State the null and alternative hypotheses to test for a difference in the two population proportions. O Ho: (P1-P2) # O versus H: (P1-P2) = 0 O Ho: (P1-P2) = 0 versus Hy: (P1-P2) > 0 HO: (P1-P2) < 0 versus Ha: (P1-P2) > 0 HO: (P1-P2) = 0...
(1 point) Independent random samples, each containing 800 observations, were selected from two binomial populations. The...
 (1 point) Independent random samples, each containing 800 observations, were selected from two binomial populations. The samples from populations 1 and 2 produced 581 and 221 successes, respectively. (a) Test Ho : (p1 – P2) = 0 against Ha : (Pi – P2) # 0. Use a = 0.01 test statistic = rejection region |z| > The final conclusion is # 0. A. We can reject the null hypothesis that (p1 – P2) = 0 and accept that (p1 –...
The numbers of successes and the sample sizes for independent simple random samples from two populations...
 The numbers of successes and the sample sizes for independent simple random samples from two populations are provided for a two-tailed test and a 95% confidence interval. Complete parts (a) through (d). Xy = 21, n = 60, X2 = 22, n2 = 100, a = 0.05 Click here to view a table of areas under the standard normal curve for negative values of Click here to view a table of areas under the standard normal curve for RoSive values...
Assume that you plan to use a significance level of a = 0.05 to test the...
Assume that you plan to use a significance level of a = 0.05 to test the claim that P1 = P2. The sample sizes and number of successes are given in the following table Treatment Group Placebo Group N1 = 500 N2 = 400 X1 = 100 X2 = 50 Find (a) the pooled estimate (b) the Z test statistic.
Independent random samples were selected from two binomial populations, with sample sizes and the number of...
Independent random samples were selected from two binomial populations, with sample sizes and the number of successes given below. Population 1 2 Sample Size 500 500 Number of Successes 121 149 Given: H0: (p1 − p2) = 0 versus Ha: (p1 − p2) ≠ 0 Solve: Calculate the necessary test statistic. (Round your answer to two decimal places.) z = ?? Calculate the p-value. (Round your answer to four decimal places.) p-value = ??
Independent random samples, each containing 90 observations, were selected from two populations. The samples from populations...
Independent random samples, each containing 90 observations, were selected from two populations. The samples from populations 1 and 2 produced 50 and 42 successes, respectively. Test H0:(p1−p2)=0 against Ha:(p1−p2)≠0. Use α=0.04. (a) The test statistic is (b) The P-value is (c) The final conclusion is A. We can reject the null hypothesis that (p1−p2)=0 and accept that (p1−p2)≠0. B. There is not sufficient evidence to reject the null hypothesis that (p1−p2)=0. side note- no idea how to find a test...
 Assume that you plan to use a significance level of a = 0.05 to test the claim that p1 - P2. Use the given sample sizes and numbers of successes to find the z test statistic for the hypothesis test. 21) In a vote on the Clean Water bill, 46% of the 205 Democrats voted for the bill while 47% of 21) the 230 Republicans voted for it. hun Identify the null hypothesis, alternative hypothesis, test statistic, P-value, conclusion about...
 3) American League baseball teams play their games with the designated hitter rule, meaning that pitchers do not bat. The league believes that replacing the pitcher, typically a weak hitter, with another player in the batting order produces more runs. Using a significance level of a = 0.05, determine if the average number of runs is higher for the American League Following are the average number of runs scored by each team in the 2016 season: American League National League...
 Independent random samples were selected from two binomial populations, with sample sizes and the number of successes given below. Population 1 2 500 500 119 148 Sample Size Number of Successes State the null and alternative hypotheses to test for a difference in the two population proportions. O Ho: (P1-P2) # O versus H: (P1-P2) = 0 O Ho: (P1-P2) = 0 versus Hy: (P1-P2) > 0 HO: (P1-P2) < 0 versus Ha: (P1-P2) > 0 HO: (P1-P2) = 0...
 (1 point) Independent random samples, each containing 800 observations, were selected from two binomial populations. The samples from populations 1 and 2 produced 581 and 221 successes, respectively. (a) Test Ho : (p1 – P2) = 0 against Ha : (Pi – P2) # 0. Use a = 0.01 test statistic = rejection region |z| > The final conclusion is # 0. A. We can reject the null hypothesis that (p1 – P2) = 0 and accept that (p1 –...
 The numbers of successes and the sample sizes for independent simple random samples from two populations are provided for a two-tailed test and a 95% confidence interval. Complete parts (a) through (d). Xy = 21, n = 60, X2 = 22, n2 = 100, a = 0.05 Click here to view a table of areas under the standard normal curve for negative values of Click here to view a table of areas under the standard normal curve for RoSive values...
Most questions answered within 3 hours.
-
Where is the error in this code sequence?
String s1 = "Hello";
String s2 = "ello";...
asked 10 months ago -
Financial data for Joel de Paris, Inc., for last year
follow:
Joel de Paris, Inc.
Balance...
asked 10 months ago -
Consider this reaction:
Al2(SO4)3 (aq)+ BaCl3
(aq) Al2Cl6 (aq)- +
3BaSO4(s) . What is the...
asked 10 months ago -
Suppose that Savneet is considering increasing her
recent random sample from 20 car rentals to 40...
asked 10 months ago -
Trucks arrive at an unloading terminal at an average rate of 120
per hour.
Trucks arrive...
asked 10 months ago -
Why are methanol and ethanol completely soluble in water while
octanol is not very little soluble....
asked 10 months ago -
A facilities manager at a university reads in a research report
that the mean amount of...
asked 10 months ago -
When the CuSO4 is rehydrated by adding water to the anhydrous
compound, is this an endothermic...
asked 10 months ago -
A ray of sunlight is passing from diamond into crown glass; the
angle of incidence is...
asked 10 months ago -
A block of mass 0.249 kg is placed on top of a light, vertical
spring of...
asked 10 months ago -
how do the kidneys compensate in the presences of acidosis
a) trigger hyperventilate
b) reserve acid...
asked 10 months ago -
Question 501 pts
The rental rate of capital to the firm increases. Which of the
following...
asked 10 months ago