Consider the data set shown below. Find the 95% confidence interval for the slope of the...
Consider the data set shown below. Find the 95% confidence interval for the slope of the regression line.
y 0 3 2 3 8 10 11
x -2 0 2 4 6 8 10
9) A) 0.94643 ± 0.27603 B) 0.94643 ± 0.33306 C) 0.94643 ± 0.28377 D) 0.94643 ± 0.36203
Homework Answers
Answer:-
Given That:-
Consider the data set shown below. Find the 95% confidence interval for the slope of the regression line.
y 0 3 2 3 8 10 11
x -2 0 2 4 6 8 10
Given,
 |
 |
 |
 |
 |
 |
 |
|
| -2 | 0 | 4 | 0 | 0 | -0.3927 | at x = -2 | 0.3927 |
| 0 | 3 | 0 | 9 | 0 | 1.5001 | at x = 0 | 1.4999 |
| 2 | 2 | 4 | 4 | 4 | 3.3929 | at x = 2 | -1.3929 |
| 4 | 3 | 16 | 9 | 12 | 5.2857 | at x = 4 | -2.2857 |
| 6 | 8 | 36 | 64 | 49 | 7.1785 | at x = 6 | 0.8215 |
| 8 | 10 | 64 | 100 | 80 | 9.0713 | at x = 8 | 0.9287 |
| 10 | 11 | 100 | 121 | 110 | 10.9641 | at x =10 | 0.0359 |

= 28/7
= 4

= 37/7
= 5.2857


= 106.0004/112
= 0.9464

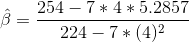
= 5.2857 - 0.9464 * 4
= 1.5001
Simple linear regression model


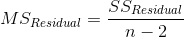
= 11.1072/7-2
= 2.2213

= 224 - 7*4 *4
= 112
100(1 -  )% confidence interval for
  is
is
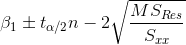
i.e,


0.9464  0.3619968
0.9464
0.36200
Here I take  ,
Take
,
Take  and perfrom calculation then you will get exact 0.9463
0.36203 95% confidence interval.
and perfrom calculation then you will get exact 0.9463
0.36203 95% confidence interval.
The correct answer is option (D)
Thank you for your supporting. Please upvote my answer...
Add Answer to:
Consider the data set shown below. Find the 95% confidence
interval for the slope of the...
Consider the data set shown below. Find the standard deviation of the least squares regression line....
Consider the data set shown below. Find the standard deviation of the least squares regression line. y 0 3 2 3 8 10 11 x -2 0 2 4 6 8 10 3) A) 1.49045 B) 1.5 C) 0.9003 D) 0.94643
Consider the data set shown below. Find the estimate of the slope of the least squares...
 Consider the data set shown
below. Find the estimate of the slope of the least squares
regression line.
| 0 | 3 | 2 | 3 s |10|11 |--|| 2 | 68110
Consider the data set shown
below. Find the estimate of the slope of the least squares
regression line.
| 0 | 3 | 2 | 3 s |10|11 |--|| 2 | 68110
Use the given set of points to construct a 95% confidence interval for the population slope...
 Use the given set of points to construct a 95% confidence interval for the population slope B1 8 6 6 12 14 11 V 21 18 21 21 28 28 24 PC Based on the data, the following are computed: x = 71, y = 176, x2 = 703, 2y = 4016, and xy = 1658 O 9.8187< B, <10.7988 0.8763 < B1 <1.7584 0.8273 < B1 <1.8074 0.8028 B, <1.8319
Consider the set of ordered pairs shown below. Assuming that the regression equation is y with...
Consider the set of ordered pairs shown below. Assuming that the regression equation is y with caret = 4.813+0.163x and the SSE=8.744, construct a 95% confidence interval for x=3. x 2 6 1 5 4 -------------------- y 6 6 5 7 3 Click the icon to view a portion of the student's t-distribution table. Calculate the upper and lower limits of the confidence interval. UCL= LCL=
For the data set below, calculate r, r2, and a 95 percent confidence interval in runits....
For the data set below, calculate r, r2, and a 95 percent confidence interval in runits. Then write a one- to two sentence conclusion statement that includes whether the null hypothesis was rejected or not and whether there is a strong /weak/no relationship. Assume a two tailed hypothesis and α = .05. Case 1 Case 2 Case 3 Case 4 Case 5 Case 6 X 1.05 1.15 1.30 2.00 1.75 1.00 Y 2 2 3 4 5 2
Question 7 Solve the problem. Consider the data set shown below. Find the estimate of the...
 Question 7 Solve the problem. Consider the data set shown below. Find the estimate of the y-intercept of the v 03 23 8 10 11 x -2 0 2 4 6 8 10 1.5 0.94643 0 1.49045 0.9003 n below. Find the estimate of the y-intercept of the least squares regression line 10 11 8 10 tion will save this response. Provide an appropriate response. In an area of the Midwest records were kept on the relationship between the rain...
1) Calculate a 95% and 99% confidence interval for the following data set. Note: this is...
1) Calculate a 95% and 99% confidence interval for the following data set. Note: this is a sample. Show your steps including the mean, z-score, standard deviation, and standard error that you use. Use the data set listed below. 12 10 18 16 11 10 9 17 6 13 10 20 21 24 18 17 19 12 11 10
Significance level of 0.05, test whether the slope of the regression line is negative. Form a 95% confidence interval on...
Significance level of 0.05, test whether the slope of the regression line is negative. Form a 95% confidence interval on the slope of the line. The regression equation is, Y = 6.0 - 0.7x predictor coef stdev t-ratio constant 6.0 2.558 2.32 X -0.7 0.086 -8.28 ANOVA source df ss ms F regression 1 648.12 648.12 68.58 error 6 56.72 9.45 total 7 704.84
Question is: Construct a 95% confidence interval for Beta1 using this data. 11.42 Consider the following...
 Question is: Construct a 95% confidence interval for
Beta1 using this data.
11.42 Consider the following pairs of observations: 6 0 11.43 R fic L11042 x 4 3 2 4 2 11.44 D
Question is: Construct a 95% confidence interval for
Beta1 using this data.
11.42 Consider the following pairs of observations: 6 0 11.43 R fic L11042 x 4 3 2 4 2 11.44 D
14.4.22 A Question Help 0 Consider the set of ordered pairs shown below. Assuming that the...
 14.4.22 A Question Help 0 Consider the set of ordered pairs shown below. Assuming that the regression equation is y = 5.413-0.239x and the SSE = 10.674, construct a 95% confidence interval for x = 2 2 X у 2 5 3 5 14 6 6 Click the icon to view a portion of the student's t-distribution table. မဟ Calculate the upper and lower limits of the confidence interval. UCL = LCL = (Round to three decimal places as needed.)
 Consider the data set shown
below. Find the estimate of the slope of the least squares
regression line.
| 0 | 3 | 2 | 3 s |10|11 |--|| 2 | 68110
Consider the data set shown
below. Find the estimate of the slope of the least squares
regression line.
| 0 | 3 | 2 | 3 s |10|11 |--|| 2 | 68110
 Use the given set of points to construct a 95% confidence interval for the population slope B1 8 6 6 12 14 11 V 21 18 21 21 28 28 24 PC Based on the data, the following are computed: x = 71, y = 176, x2 = 703, 2y = 4016, and xy = 1658 O 9.8187< B, <10.7988 0.8763 < B1 <1.7584 0.8273 < B1 <1.8074 0.8028 B, <1.8319
 Question 7 Solve the problem. Consider the data set shown below. Find the estimate of the y-intercept of the v 03 23 8 10 11 x -2 0 2 4 6 8 10 1.5 0.94643 0 1.49045 0.9003 n below. Find the estimate of the y-intercept of the least squares regression line 10 11 8 10 tion will save this response. Provide an appropriate response. In an area of the Midwest records were kept on the relationship between the rain...
 Question is: Construct a 95% confidence interval for
Beta1 using this data.
11.42 Consider the following pairs of observations: 6 0 11.43 R fic L11042 x 4 3 2 4 2 11.44 D
Question is: Construct a 95% confidence interval for
Beta1 using this data.
11.42 Consider the following pairs of observations: 6 0 11.43 R fic L11042 x 4 3 2 4 2 11.44 D
 14.4.22 A Question Help 0 Consider the set of ordered pairs shown below. Assuming that the regression equation is y = 5.413-0.239x and the SSE = 10.674, construct a 95% confidence interval for x = 2 2 X у 2 5 3 5 14 6 6 Click the icon to view a portion of the student's t-distribution table. မဟ Calculate the upper and lower limits of the confidence interval. UCL = LCL = (Round to three decimal places as needed.)
Most questions answered within 3 hours.
-
Where is the error in this code sequence?
String s1 = "Hello";
String s2 = "ello";...
asked 11 months ago -
Financial data for Joel de Paris, Inc., for last year
follow:
Joel de Paris, Inc.
Balance...
asked 11 months ago -
Consider this reaction:
Al2(SO4)3 (aq)+ BaCl3
(aq) Al2Cl6 (aq)- +
3BaSO4(s) . What is the...
asked 11 months ago -
Suppose that Savneet is considering increasing her
recent random sample from 20 car rentals to 40...
asked 11 months ago -
Trucks arrive at an unloading terminal at an average rate of 120
per hour.
Trucks arrive...
asked 11 months ago -
Why are methanol and ethanol completely soluble in water while
octanol is not very little soluble....
asked 11 months ago -
A facilities manager at a university reads in a research report
that the mean amount of...
asked 11 months ago -
When the CuSO4 is rehydrated by adding water to the anhydrous
compound, is this an endothermic...
asked 11 months ago -
A ray of sunlight is passing from diamond into crown glass; the
angle of incidence is...
asked 11 months ago -
A block of mass 0.249 kg is placed on top of a light, vertical
spring of...
asked 11 months ago -
how do the kidneys compensate in the presences of acidosis
a) trigger hyperventilate
b) reserve acid...
asked 11 months ago -
Question 501 pts
The rental rate of capital to the firm increases. Which of the
following...
asked 11 months ago