
Homework Answers


Add Answer to:
1 pressure-volume thermodynamics process p = f(V) can be expressed by tabled data below: Volume V...
The pressure P and volume V of a certain amount of steam in an adiabatic process...
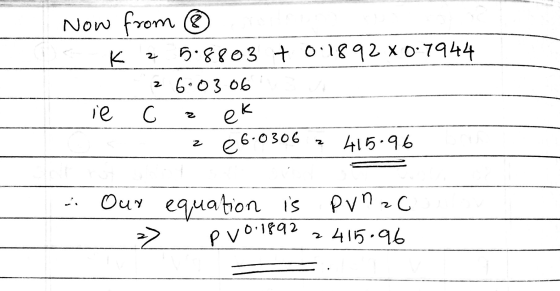
 The pressure P and volume V of a certain amount of steam in an adiabatic process (a process in which the heat in the system does not change due to proper insulation) fairly follows the equation PVY K where y and K are constants. In an adiabatic experiment, the volume of a certain amount of steam confined in a tank is gradually increased, resulting in a decrease in gas pressure. Using the above equation and linear regression, find the values...
It is expected that the data listed below between the vapour pressure p of water (in...
 It is expected that the data listed below between the vapour
pressure p of water (in kPa) at different temperatures T (in K)
will follow the relationship:
where A and B are two constants which can be determined via
curve fitting.
Estimate A and B based on the first two entries of the data
below and calculate the error of using these values as a curve-fit
for all the data.
Data:
Temperature (K)
Vapour Pressure (p)
2.7300000e+002
5.9995066e-001
2.7800000e+002
9.0659211e-001...
It is expected that the data listed below between the vapour
pressure p of water (in kPa) at different temperatures T (in K)
will follow the relationship:
where A and B are two constants which can be determined via
curve fitting.
Estimate A and B based on the first two entries of the data
below and calculate the error of using these values as a curve-fit
for all the data.
Data:
Temperature (K)
Vapour Pressure (p)
2.7300000e+002
5.9995066e-001
2.7800000e+002
9.0659211e-001...
The following data obtained from a sample gas at given temperature Calculate 1/Volume (1/V) and Pressure...
 The following data obtained from a sample gas at given temperature Calculate 1/Volume (1/V) and Pressure - Volume product (PV) and fill in the table. Plot a graph of Pressure (P) vs 1/Volume (1/V) Using the graph find the Volume of the gas at 1710 mm Hg. Do the Pressure-Volume products follow the Boyle's Law? Explain.
A pressure versus volume (P-V) diagram for a system is shown in the figure. The arrows...
 A pressure versus volume (P-V) diagram for a system is shown in the figure. The arrows of the curve indicate the direction of the process, and the points of interest are labeled. The values for the points in the diagram are shown in the table. Pressure (Pa) Volume (m) Vo = 27.0 Vi = 20.2 V2 = 17.4 Vj = 14.2 V = 14.2 Vs = 7.51 Pressure (Pa) Po = 1.37 104 P1 = 1.37 104 P2 = 6.18...
(V) DATA AND RESULTS: 3 Pressure. P (kPa) Volume, V (L) PxV_(kPa*L) 1P. (1/kPa) 114.821 1.5...
 (V) DATA AND RESULTS: 3 Pressure. P (kPa) Volume, V (L) PxV_(kPa*L) 1P. (1/kPa) 114.821 1.5 172.2315 0.0087092082 117.757 0.0084920642 141.3084 108.5544 120.616 09 0.008290774 123.346 0.6 74.0076 0.0081072755 126.048 04 50.4192 0.0079334857 VI) QUESTIONS: State the relationship between pressure and volume as stated by Boyle's law. Remember to state the condition of temperature. (W) Is the Boyle's law confirmed by your graph? Explain If the pressure of a sample of gas in a cylinder is 760 mm of Hg...
A pressure versus volume (P-V) diagram for a system is shown in the figure. The arrows...
 A pressure versus volume (P-V) diagram for a system is shown in the figure. The arrows of the curve indicate the direction of the process, and the points of interest are labeled. The values for the points in the diagram are shown in the table. Volume (m) Pressure (Pa) Vo = 26.6 Po = 1.37 x 10⁴ Vi = 19.3 P1 = 1.37 x 10⁴ V2 = 17.0 P2 = 4.50 x 10 V3 = 13.9 P = 4.50 x...
A pressure versus volume (P-V) diagram for a system is shown in the figure. The arrows...
 A pressure versus volume (P-V) diagram for a system is shown in the figure. The arrows of the curve indicate the direction of the process, and the points of interest are labeled. The values for the points in the diagram are shown in the table. 0 Volume (m Pressure (Pa) Po 1.37 x 10⁴ 19.9 | p,-1.37x10⁴ 2 16.6 P2 5.13 x 10³ Ps 5.13 x 10³ P4 2.92 x 10³ 8:19 | ps = 1.57x10³ , = 13.6 Calculate...
Map Sapling Learning A pressure versus volume (pV) diagram is shown in the figure below for a indicate the direction of the process and the points of interest are labelled. Calculate the amount o...
 Map Sapling Learning A pressure versus volume (pV) diagram is shown in the figure below for a indicate the direction of the process and the points of interest are labelled. Calculate the amount of work done on the system from 0 2 and then for the entire curve 0 5. The values for the points in the diagranm are The arrows of the curve Pressure (Pa) 1.00 x10 Pi1.00 x104 471 x103 34.71 x 10 43.20 x10³ 1.00 x 10³...
A pressure versus volume (P-V) diagram for a system is shown in the figure. The arrows...
 A pressure versus volume (P-V) diagram for a system is shown in the figure. The arrows of the curve indicate the direction of the process, and the points of interest are labeled. The values for the points in the diagram are shown in the table. Pressure (Pa) Volume (m) Pressure (Pa) V = 25.0 Po = 1.00 x 10 Vi = 21.4 P1 = 1.00 x 10 V2 = 17.2 P2 = 6.18 x 10 V3 = 13.6 P3 =...
The state of an ideal gas can be represented by a point on a PV (pressure-volume)...
 The state of an ideal gas can be represented by a point on a PV
(pressure-volume) diagram. If you know the quantity of gas, n, a
unique point in pressure (P) and volume (V) can be used to
determine a temperature (T). Each point on a PV diagram also has a
single internal energy (U) assigned to it. If a process starts at a
point and returns to that same point on a PV diagram, it returns to
the same...
The state of an ideal gas can be represented by a point on a PV
(pressure-volume) diagram. If you know the quantity of gas, n, a
unique point in pressure (P) and volume (V) can be used to
determine a temperature (T). Each point on a PV diagram also has a
single internal energy (U) assigned to it. If a process starts at a
point and returns to that same point on a PV diagram, it returns to
the same...
 The pressure P and volume V of a certain amount of steam in an adiabatic process (a process in which the heat in the system does not change due to proper insulation) fairly follows the equation PVY K where y and K are constants. In an adiabatic experiment, the volume of a certain amount of steam confined in a tank is gradually increased, resulting in a decrease in gas pressure. Using the above equation and linear regression, find the values...
 It is expected that the data listed below between the vapour
pressure p of water (in kPa) at different temperatures T (in K)
will follow the relationship:
where A and B are two constants which can be determined via
curve fitting.
Estimate A and B based on the first two entries of the data
below and calculate the error of using these values as a curve-fit
for all the data.
Data:
Temperature (K)
Vapour Pressure (p)
2.7300000e+002
5.9995066e-001
2.7800000e+002
9.0659211e-001...
It is expected that the data listed below between the vapour
pressure p of water (in kPa) at different temperatures T (in K)
will follow the relationship:
where A and B are two constants which can be determined via
curve fitting.
Estimate A and B based on the first two entries of the data
below and calculate the error of using these values as a curve-fit
for all the data.
Data:
Temperature (K)
Vapour Pressure (p)
2.7300000e+002
5.9995066e-001
2.7800000e+002
9.0659211e-001...
 The following data obtained from a sample gas at given temperature Calculate 1/Volume (1/V) and Pressure - Volume product (PV) and fill in the table. Plot a graph of Pressure (P) vs 1/Volume (1/V) Using the graph find the Volume of the gas at 1710 mm Hg. Do the Pressure-Volume products follow the Boyle's Law? Explain.
 A pressure versus volume (P-V) diagram for a system is shown in the figure. The arrows of the curve indicate the direction of the process, and the points of interest are labeled. The values for the points in the diagram are shown in the table. Pressure (Pa) Volume (m) Vo = 27.0 Vi = 20.2 V2 = 17.4 Vj = 14.2 V = 14.2 Vs = 7.51 Pressure (Pa) Po = 1.37 104 P1 = 1.37 104 P2 = 6.18...
 (V) DATA AND RESULTS: 3 Pressure. P (kPa) Volume, V (L) PxV_(kPa*L) 1P. (1/kPa) 114.821 1.5 172.2315 0.0087092082 117.757 0.0084920642 141.3084 108.5544 120.616 09 0.008290774 123.346 0.6 74.0076 0.0081072755 126.048 04 50.4192 0.0079334857 VI) QUESTIONS: State the relationship between pressure and volume as stated by Boyle's law. Remember to state the condition of temperature. (W) Is the Boyle's law confirmed by your graph? Explain If the pressure of a sample of gas in a cylinder is 760 mm of Hg...
 A pressure versus volume (P-V) diagram for a system is shown in the figure. The arrows of the curve indicate the direction of the process, and the points of interest are labeled. The values for the points in the diagram are shown in the table. Volume (m) Pressure (Pa) Vo = 26.6 Po = 1.37 x 10⁴ Vi = 19.3 P1 = 1.37 x 10⁴ V2 = 17.0 P2 = 4.50 x 10 V3 = 13.9 P = 4.50 x...
 A pressure versus volume (P-V) diagram for a system is shown in the figure. The arrows of the curve indicate the direction of the process, and the points of interest are labeled. The values for the points in the diagram are shown in the table. 0 Volume (m Pressure (Pa) Po 1.37 x 10⁴ 19.9 | p,-1.37x10⁴ 2 16.6 P2 5.13 x 10³ Ps 5.13 x 10³ P4 2.92 x 10³ 8:19 | ps = 1.57x10³ , = 13.6 Calculate...
 Map Sapling Learning A pressure versus volume (pV) diagram is shown in the figure below for a indicate the direction of the process and the points of interest are labelled. Calculate the amount of work done on the system from 0 2 and then for the entire curve 0 5. The values for the points in the diagranm are The arrows of the curve Pressure (Pa) 1.00 x10 Pi1.00 x104 471 x103 34.71 x 10 43.20 x10³ 1.00 x 10³...
 A pressure versus volume (P-V) diagram for a system is shown in the figure. The arrows of the curve indicate the direction of the process, and the points of interest are labeled. The values for the points in the diagram are shown in the table. Pressure (Pa) Volume (m) Pressure (Pa) V = 25.0 Po = 1.00 x 10 Vi = 21.4 P1 = 1.00 x 10 V2 = 17.2 P2 = 6.18 x 10 V3 = 13.6 P3 =...
 The state of an ideal gas can be represented by a point on a PV
(pressure-volume) diagram. If you know the quantity of gas, n, a
unique point in pressure (P) and volume (V) can be used to
determine a temperature (T). Each point on a PV diagram also has a
single internal energy (U) assigned to it. If a process starts at a
point and returns to that same point on a PV diagram, it returns to
the same...
The state of an ideal gas can be represented by a point on a PV
(pressure-volume) diagram. If you know the quantity of gas, n, a
unique point in pressure (P) and volume (V) can be used to
determine a temperature (T). Each point on a PV diagram also has a
single internal energy (U) assigned to it. If a process starts at a
point and returns to that same point on a PV diagram, it returns to
the same...
Most questions answered within 3 hours.
-
Where is the error in this code sequence?
String s1 = "Hello";
String s2 = "ello";...
asked 10 months ago -
Financial data for Joel de Paris, Inc., for last year
follow:
Joel de Paris, Inc.
Balance...
asked 10 months ago -
Consider this reaction:
Al2(SO4)3 (aq)+ BaCl3
(aq) Al2Cl6 (aq)- +
3BaSO4(s) . What is the...
asked 10 months ago -
Suppose that Savneet is considering increasing her
recent random sample from 20 car rentals to 40...
asked 10 months ago -
Trucks arrive at an unloading terminal at an average rate of 120
per hour.
Trucks arrive...
asked 10 months ago -
Why are methanol and ethanol completely soluble in water while
octanol is not very little soluble....
asked 10 months ago -
A facilities manager at a university reads in a research report
that the mean amount of...
asked 10 months ago -
When the CuSO4 is rehydrated by adding water to the anhydrous
compound, is this an endothermic...
asked 10 months ago -
A ray of sunlight is passing from diamond into crown glass; the
angle of incidence is...
asked 10 months ago -
A block of mass 0.249 kg is placed on top of a light, vertical
spring of...
asked 10 months ago -
how do the kidneys compensate in the presences of acidosis
a) trigger hyperventilate
b) reserve acid...
asked 10 months ago -
Question 501 pts
The rental rate of capital to the firm increases. Which of the
following...
asked 10 months ago