Are phone calls equally likely to occur any day of the week? The day of the...
Are phone calls equally likely to occur any day of the week? The day of the week for each of 525 randomly selected phone calls was observed. The results are displayed in the table below. Use an αα = 0.05 significance level.
- Complete the rest of the table by filling in the expected
frequencies:
Frequencies of Phone Calls for Each Day of the Week Outcome Frequency Expected Frequency Sunday 80 Monday 73 Tuesday 69 Wednesday 71 Thursday 80 Friday 77 Saturday 75 - What is the correct statistical test to use?
Select an answer Homogeneity Independence Goodness-of-Fit Paired t-test - What are the null and alternative hypotheses?
H0:H0:- Phone calls and days of the week are independent.
- The distribution of phone calls is uniform over the days of the week.
- The distribution of phone calls is not uniform over the days of the week.
- Phone calls and days of the week are dependent.
H1:H1:- The distribution of phone calls is uniform over the days of the week.
- Phone calls and days of the week are dependent.
- Phone calls and days of the week are independent.
- The distribution of phone calls is not uniform over the days of the week.
- The degrees of freedom =
- The test-statistic for this data = (Please show your
answer to three decimal places.)
- The p-value for this sample = (Please show your answer to four
decimal places.)
- The p-value is Select an answer greater than less than (or
equal to) αα
- Based on this, we should Select an answer fail to reject the null reject the null accept the null
- Thus, the final conclusion is...
- There is sufficient evidence to conclude that phone calls and days of the week are dependent.
- There is insufficient evidence to conclude that phone calls and days of the week are dependent.
- There is insufficient evidence to conclude that the distribution of phone calls is not uniform over the days of the week.
- There is sufficient evidence to conclude that the distribution of phone calls is not uniform over the days of the week.
- There is sufficient evidence to conclude that the distribution of phone calls is uniform over the days of the week.
Homework Answers
The correct statistical test is Goodness of fit test.
H0: the distribution of phone calls is uniform over the days of week.
H1: the distribution of phone calls is not uniform over the days of week.


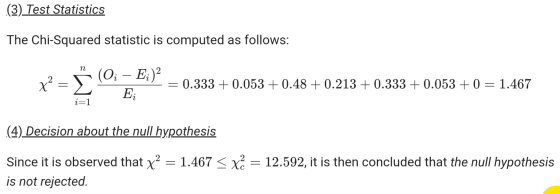

Ans: there is sufficient evidence to conclude that the distribution of phone calls is uniform over the days of the week.
I have given my best to solve your problem. Please like the answer if you are satisfied with it. ?
Add Answer to:
Are phone calls equally likely to occur any day of the week? The
day of the...
Are phone calls equally likely to occur any day of the week? The day of the...
Are phone calls equally likely to occur any day of the week? The day of the week for each of 504 randomly selected phone calls was observed. The results are displayed in the table below. Use an αα = 0.05 significance level. Complete the rest of the table by filling in the expected frequencies: Frequencies of Phone Calls for Each Day of the Week Outcome Frequency Expected Frequency Sunday 56 Monday 52 Tuesday 61 Wednesday 92 Thursday 73 Friday...
Are phone calls equally likely to occur any day of the week? The day of the...
 Are phone calls equally likely to occur any day of the week? The day of the week for each of 700 randomly selected phone calls was observed. The results are displayed in the table below. Use an a=0.01 significance level. a. Complete the rest of the table by filling in the expected frequencies: Frequencies of Phone Calls for Each Day of the Week Outcome Frequency Expected Frequency Sunday 112 Monday 120 Tuesday 115 Wednesday 87 Thursday 73 Friday 91 Saturday...
Timelimit: 3 hours. x] Show Intro/Instructions Are phone calls equally likely to occur any day of...
 Timelimit: 3 hours. x] Show Intro/Instructions Are phone calls equally likely to occur any day of the week? The day of the week for each of 434 randomly selected phone calls was observed. The results are displayed in the table below. Use an a = 0.10 significance level. a. Complete the rest of the table by filling in the expected frequencies: Frequencies of Phone Calls for Each Day of the Week Outcome Frequency Expected Frequency Sunday 62 Monday 56 Tuesday...
Are phone calls equally likely to occur any day of the week? The day of the...
 Are phone calls equally likely to occur any day of the week? The day of the week for each of 651 randomly selected phone calls was observed. The results are displayed in the table below. Use an a = 0.05 significance level. a. Complete the rest of the table by filling in the expected frequencies: Frequencies of Phone Calls for Each Day of the Week Outcome Frequency Expected Frequency Sunday 90 Monday 93 Tuesday 97 Wednesday 79 Thursday 89 Friday...
Suppose a random sample of 924 athletes from the college are asked what their m...
 Suppose a random sample of 924 athletes from the college are asked what their major is. The table below shows the results of the survey Observed Frequencies of Majors from the Sample Outcome Observed Frequency Math Science 286 Arts & Humanities Business & Economics 247 Other 253 138 The distribution of majors at the college is shown in the second column of the table below. Fill in the expected frequencies (Round to the nearest whole number). Frequencies of Majors at...
A die is rolled 120 times to see if it is fair. The table below shows...
A die is rolled 120 times to see if it is fair. The table below shows the frequencies for each of the six possible outcomes. Use a level of significance of αα = 0.05. Complete the rest of the table by filling in the expected frequencies (enter your answers in fraction form): Frequency of Dice Values Outcome Frequency Expected Frequency 1 17 2 20 3 17 4 27 5 19 6 20 Data: 17,20,17,27,19,20 Excel data Expected Frequency for Outcome...
Do men and women select different breakfasts? The breakfasts ordered by randomly selected men and women...
Do men and women select different breakfasts? The breakfasts ordered by randomly selected men and women at a popular breakfast place are shown below. Frequencies of Breakfasts for Men and Women French Toast Pancakes Waffles Omelets Men 82 51 92 70 Women 98 60 112 53 What can be concluded at the αα = 0.05 significance level? What is the correct statistical test to use? Paired t-test Goodness-of-Fit Homogeneity Independence What are the null and alternative hypotheses? H0:H0: Breakfast ordered...
A recent national report states the marital status distribution of the male population age 18 or...
A recent national report states the marital status distribution of the male population age 18 or older is as follows: Never Married (31.7%), Married (54.8%), Widowed (3%), Divorced (10.5%). The table below shows the results of a random sample of 1768 adult men from California. Test the claim that the distribution from California is as expected at the αα = 0.05 significance level. Complete the table by filling in the expected frequencies. Round to the nearest whole number: Frequencies of Marital...
A die is rolled 120 times to see if it is fair. The table below shows...
 A die is rolled 120 times to see if it is fair. The table below shows the frequencies for each of the six possible outcomes. Use a level of significance of a=0.10. a. Complete the rest of the table by filling in the expected frequencies (enter your answers in fraction form) Frequency of Dice Values Outcome Frequency Expected Frequency aw- b. What is the correct statistical test to use? Select an answer c. What are the null and alternative hypotheses?...
 Are phone calls equally likely to occur any day of the week? The day of the week for each of 700 randomly selected phone calls was observed. The results are displayed in the table below. Use an a=0.01 significance level. a. Complete the rest of the table by filling in the expected frequencies: Frequencies of Phone Calls for Each Day of the Week Outcome Frequency Expected Frequency Sunday 112 Monday 120 Tuesday 115 Wednesday 87 Thursday 73 Friday 91 Saturday...
 Are phone calls equally likely to occur any day of the week? The day of the week for each of 700 randomly selected phone calls was observed. The results are displayed in the table below. Use an a=0.01 significance level. a. Complete the rest of the table by filling in the expected frequencies: Frequencies of Phone Calls for Each Day of the Week Outcome Frequency Expected Frequency Sunday 112 Monday 120 Tuesday 115 Wednesday 87 Thursday 73 Friday 91 Saturday...
 Timelimit: 3 hours. x] Show Intro/Instructions Are phone calls equally likely to occur any day of the week? The day of the week for each of 434 randomly selected phone calls was observed. The results are displayed in the table below. Use an a = 0.10 significance level. a. Complete the rest of the table by filling in the expected frequencies: Frequencies of Phone Calls for Each Day of the Week Outcome Frequency Expected Frequency Sunday 62 Monday 56 Tuesday...
 Are phone calls equally likely to occur any day of the week? The day of the week for each of 651 randomly selected phone calls was observed. The results are displayed in the table below. Use an a = 0.05 significance level. a. Complete the rest of the table by filling in the expected frequencies: Frequencies of Phone Calls for Each Day of the Week Outcome Frequency Expected Frequency Sunday 90 Monday 93 Tuesday 97 Wednesday 79 Thursday 89 Friday...
 Suppose a random sample of 924 athletes from the college are asked what their major is. The table below shows the results of the survey Observed Frequencies of Majors from the Sample Outcome Observed Frequency Math Science 286 Arts & Humanities Business & Economics 247 Other 253 138 The distribution of majors at the college is shown in the second column of the table below. Fill in the expected frequencies (Round to the nearest whole number). Frequencies of Majors at...
 A die is rolled 120 times to see if it is fair. The table below shows the frequencies for each of the six possible outcomes. Use a level of significance of a=0.10. a. Complete the rest of the table by filling in the expected frequencies (enter your answers in fraction form) Frequency of Dice Values Outcome Frequency Expected Frequency aw- b. What is the correct statistical test to use? Select an answer c. What are the null and alternative hypotheses?...
Most questions answered within 3 hours.
-
Where is the error in this code sequence?
String s1 = "Hello";
String s2 = "ello";...
asked 11 months ago -
Financial data for Joel de Paris, Inc., for last year
follow:
Joel de Paris, Inc.
Balance...
asked 11 months ago -
Consider this reaction:
Al2(SO4)3 (aq)+ BaCl3
(aq) Al2Cl6 (aq)- +
3BaSO4(s) . What is the...
asked 11 months ago -
Suppose that Savneet is considering increasing her
recent random sample from 20 car rentals to 40...
asked 11 months ago -
Trucks arrive at an unloading terminal at an average rate of 120
per hour.
Trucks arrive...
asked 11 months ago -
Why are methanol and ethanol completely soluble in water while
octanol is not very little soluble....
asked 11 months ago -
A facilities manager at a university reads in a research report
that the mean amount of...
asked 11 months ago -
When the CuSO4 is rehydrated by adding water to the anhydrous
compound, is this an endothermic...
asked 11 months ago -
A ray of sunlight is passing from diamond into crown glass; the
angle of incidence is...
asked 11 months ago -
A block of mass 0.249 kg is placed on top of a light, vertical
spring of...
asked 11 months ago -
how do the kidneys compensate in the presences of acidosis
a) trigger hyperventilate
b) reserve acid...
asked 11 months ago -
Question 501 pts
The rental rate of capital to the firm increases. Which of the
following...
asked 11 months ago