
Homework Answers
Add Answer to:
Question 2 (36 points): A multiple linear regression analysis is performed and the following MINITAB output...
Question 2: A multiple linear regression analysis is performed and the following MINITAB output is observed:...
 Question 2: A multiple linear regression analysis is performed and the following MINITAB output is observed: Regression Analysis: Fuel cell power versus H2 pressure and H2 flow The Regression Equation is Fuel cell power (W) = 2705.235 - 1.0745*H2 pressure (psi) + 3.7707*Hz flow (stoc) Term Coef SE Coef T-Value Constant 334.44 H2 pressure (psi) 9.09 Ha flow (stoc) 2.18 MS F-Value Analysis of Variance Source DF Regression Error Total 27 SS 3770.7 7751.78 Answer to the following questions based...
The following table is the output of multiple linear regression analysis. a. Use the table to...
 The following table is the output of multiple linear regression
analysis.
a. Use the table to report the F statistic. What is its degree of
freedom? What is the number of observations.
b. Find the p-value related to F on the computer output and report
its value. Using the p-value, test the significance of the
regression model at the .10, .05, .01, and .001 levels of
significance. What do you conclude?
Please show work and explain each step!
df ANOVA...
The following table is the output of multiple linear regression
analysis.
a. Use the table to report the F statistic. What is its degree of
freedom? What is the number of observations.
b. Find the p-value related to F on the computer output and report
its value. Using the p-value, test the significance of the
regression model at the .10, .05, .01, and .001 levels of
significance. What do you conclude?
Please show work and explain each step!
df ANOVA...
CALCULATOR The following is a partial computer output of a multiple regression analysis of a data set containing 20...
 CALCULATOR The following is a partial computer output of a multiple regression analysis of a data set containing 20 sets of observations on the dependent variabl The regression equation is SALEPRIC 1470+0.8145 LANDVAL + 0.8204 IMPROVAL +13.529 AREA Predictor Coef SE Coef T P Constant 1470 5746 0.26 0.801 LANDVAL 0.8145 0.5122 1.59 0.131 IMPROVAL 0.8204 0.2112 3.88 0.0001 AREA 13.529 6.586 2.05 0.057 S 79190.48 R-Sq 89.7% R-Sq(ad) =87.8% Analysis of Variance Source DF SS MS Regression 3 2926558914...
Use the Minitab output to answer the following questions. 1. What is the estimated value of...
 Use the Minitab output to answer the following questions. 1. What is the estimated value of B2? 2. What is the value of SST? 3. What is the value of MSR? 4. What is the value of S2? 5. What is the predicted value of Y when X1 = 7, X2 = 5, and X3 = 3? (round your answer to two decimal places) 6. What is the residual for the predicted value in question 5? The value of Y...
QUESTION 2 In multiple linear regression analysis, the number of independent variables should be as large...
QUESTION 2 In multiple linear regression analysis, the number of independent variables should be as large as possible. more than 5. guided by economic theory. enough to guarantee that statistical significance is achieved. QUESTION 3 Omitted variable bias occurs when always occurs when performing simple linear regression analysis. independent variables that should be included in the analysis are not included and those independent variables are related to the variables in the regression model. independent variables that should not be included...
(10 points) The following regression output is available. Notice that some of the values are missing....
 (10 points) The following regression output is
available. Notice that some of the values are missing.
Predictor Coef SE
Coef T P
Constant 5.932 2.558 2.320 0.068
x 0.511 6.083 0.001
Analysis of Variance
Source DF SS MS F P
Regression 648.72 648.72 57.20 0.001
Residual
Error 56.70
Total 16 705.43
Based on the information given, what is the value of sum of
squares of the X’s (SSxx)?
7626.92
23.142
535.591
None of the above
1. (10 points) Consider the following partially completed computer printout for a regression analysis Based on the information provided, which of the following statements is true at a...
(10 points) The following regression output is
available. Notice that some of the values are missing.
Predictor Coef SE
Coef T P
Constant 5.932 2.558 2.320 0.068
x 0.511 6.083 0.001
Analysis of Variance
Source DF SS MS F P
Regression 648.72 648.72 57.20 0.001
Residual
Error 56.70
Total 16 705.43
Based on the information given, what is the value of sum of
squares of the X’s (SSxx)?
7626.92
23.142
535.591
None of the above
1. (10 points) Consider the following partially completed computer printout for a regression analysis Based on the information provided, which of the following statements is true at a...
4. The following is the output of linear regression analysis, which includes dummy variables and interactions....
 4. The following is the output of linear regression analysis, which includes dummy variables and interactions. The following are the variables: Y = Birth weights of infants born in preterm in three hospitals (A, B and C) X = Gestation age in weeks flif infant was born in Hospital A 10 Otherwise s X2= flif infant was born in Hospital B 10 Otherwise Variable Coefficient Standard deviation 1 P (approximate) Constant -1.1361 4904 .07648 01523 .7433 .6388 X -.8239 .6298...
can you do 32 and 33 for me plz ? just 2 multiple choices thanks Consider the following Excel regression output Date Analysis (picture is automatic) SUMMARY OUTPUT output of six data points on a resta...
 can you do 32 and 33 for me
plz ? just 2 multiple choices thanks
Consider the following Excel regression output Date Analysis (picture is automatic) SUMMARY OUTPUT output of six data points on a restaurant bill and corresponding tip. Bill Line Fit Plot R Square 0.828159148 0.685847574 0.607309468 3.265807868 R Square Stendard Error Total 10.66550103 Coefficients Standard Evor 0,347279172 .936081493 D.08872967 0.9 9551584 32) Choose correct correlation interpretation: (a) Positive correlation of 0.83- strong corelation. Percentage of variation explained...
can you do 32 and 33 for me
plz ? just 2 multiple choices thanks
Consider the following Excel regression output Date Analysis (picture is automatic) SUMMARY OUTPUT output of six data points on a restaurant bill and corresponding tip. Bill Line Fit Plot R Square 0.828159148 0.685847574 0.607309468 3.265807868 R Square Stendard Error Total 10.66550103 Coefficients Standard Evor 0,347279172 .936081493 D.08872967 0.9 9551584 32) Choose correct correlation interpretation: (a) Positive correlation of 0.83- strong corelation. Percentage of variation explained...
Q1 (30 points) Consider Problem 11.45, Page 637. Please note that for this problem the data...
 Q1 (30 points) Consider Problem 11.45, Page 637. Please note that for this problem the data will be entered in R as follows: #Enter data on x = Dose Level of Drug, and y = Potency of Drug (Problem 11.45, page 637) x<-c(2, 2, 2, 4, 4, 8, 8, 16, 16, 16, 32, 32, 64, 64, 64) y<-c(5, 7, 3, 10, 14, 15, 17, 20, 21, 19, 23, 29, 28, 31, 30) For this problem, answer the following questions. In...
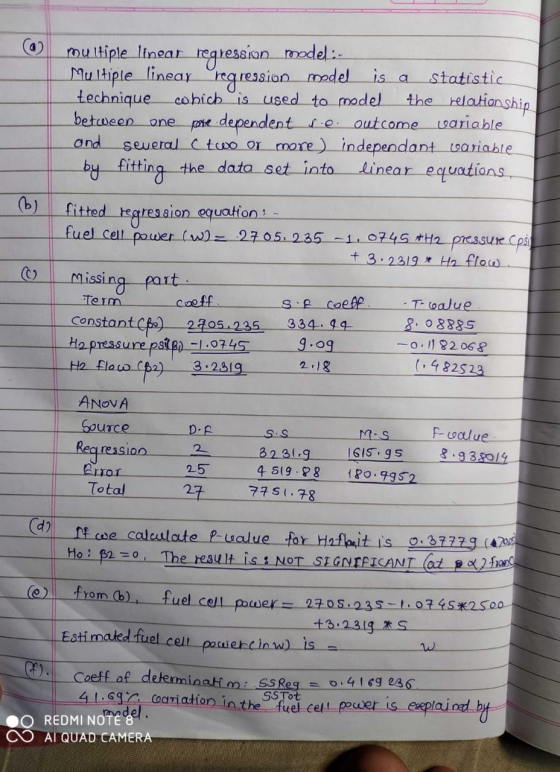
 Question 2: A multiple linear regression analysis is performed and the following MINITAB output is observed: Regression Analysis: Fuel cell power versus H2 pressure and H2 flow The Regression Equation is Fuel cell power (W) = 2705.235 - 1.0745*H2 pressure (psi) + 3.7707*Hz flow (stoc) Term Coef SE Coef T-Value Constant 334.44 H2 pressure (psi) 9.09 Ha flow (stoc) 2.18 MS F-Value Analysis of Variance Source DF Regression Error Total 27 SS 3770.7 7751.78 Answer to the following questions based...
 The following table is the output of multiple linear regression
analysis.
a. Use the table to report the F statistic. What is its degree of
freedom? What is the number of observations.
b. Find the p-value related to F on the computer output and report
its value. Using the p-value, test the significance of the
regression model at the .10, .05, .01, and .001 levels of
significance. What do you conclude?
Please show work and explain each step!
df ANOVA...
The following table is the output of multiple linear regression
analysis.
a. Use the table to report the F statistic. What is its degree of
freedom? What is the number of observations.
b. Find the p-value related to F on the computer output and report
its value. Using the p-value, test the significance of the
regression model at the .10, .05, .01, and .001 levels of
significance. What do you conclude?
Please show work and explain each step!
df ANOVA...
 CALCULATOR The following is a partial computer output of a multiple regression analysis of a data set containing 20 sets of observations on the dependent variabl The regression equation is SALEPRIC 1470+0.8145 LANDVAL + 0.8204 IMPROVAL +13.529 AREA Predictor Coef SE Coef T P Constant 1470 5746 0.26 0.801 LANDVAL 0.8145 0.5122 1.59 0.131 IMPROVAL 0.8204 0.2112 3.88 0.0001 AREA 13.529 6.586 2.05 0.057 S 79190.48 R-Sq 89.7% R-Sq(ad) =87.8% Analysis of Variance Source DF SS MS Regression 3 2926558914...
 Use the Minitab output to answer the following questions. 1. What is the estimated value of B2? 2. What is the value of SST? 3. What is the value of MSR? 4. What is the value of S2? 5. What is the predicted value of Y when X1 = 7, X2 = 5, and X3 = 3? (round your answer to two decimal places) 6. What is the residual for the predicted value in question 5? The value of Y...
 (10 points) The following regression output is
available. Notice that some of the values are missing.
Predictor Coef SE
Coef T P
Constant 5.932 2.558 2.320 0.068
x 0.511 6.083 0.001
Analysis of Variance
Source DF SS MS F P
Regression 648.72 648.72 57.20 0.001
Residual
Error 56.70
Total 16 705.43
Based on the information given, what is the value of sum of
squares of the X’s (SSxx)?
7626.92
23.142
535.591
None of the above
1. (10 points) Consider the following partially completed computer printout for a regression analysis Based on the information provided, which of the following statements is true at a...
(10 points) The following regression output is
available. Notice that some of the values are missing.
Predictor Coef SE
Coef T P
Constant 5.932 2.558 2.320 0.068
x 0.511 6.083 0.001
Analysis of Variance
Source DF SS MS F P
Regression 648.72 648.72 57.20 0.001
Residual
Error 56.70
Total 16 705.43
Based on the information given, what is the value of sum of
squares of the X’s (SSxx)?
7626.92
23.142
535.591
None of the above
1. (10 points) Consider the following partially completed computer printout for a regression analysis Based on the information provided, which of the following statements is true at a...
 4. The following is the output of linear regression analysis, which includes dummy variables and interactions. The following are the variables: Y = Birth weights of infants born in preterm in three hospitals (A, B and C) X = Gestation age in weeks flif infant was born in Hospital A 10 Otherwise s X2= flif infant was born in Hospital B 10 Otherwise Variable Coefficient Standard deviation 1 P (approximate) Constant -1.1361 4904 .07648 01523 .7433 .6388 X -.8239 .6298...
 can you do 32 and 33 for me
plz ? just 2 multiple choices thanks
Consider the following Excel regression output Date Analysis (picture is automatic) SUMMARY OUTPUT output of six data points on a restaurant bill and corresponding tip. Bill Line Fit Plot R Square 0.828159148 0.685847574 0.607309468 3.265807868 R Square Stendard Error Total 10.66550103 Coefficients Standard Evor 0,347279172 .936081493 D.08872967 0.9 9551584 32) Choose correct correlation interpretation: (a) Positive correlation of 0.83- strong corelation. Percentage of variation explained...
can you do 32 and 33 for me
plz ? just 2 multiple choices thanks
Consider the following Excel regression output Date Analysis (picture is automatic) SUMMARY OUTPUT output of six data points on a restaurant bill and corresponding tip. Bill Line Fit Plot R Square 0.828159148 0.685847574 0.607309468 3.265807868 R Square Stendard Error Total 10.66550103 Coefficients Standard Evor 0,347279172 .936081493 D.08872967 0.9 9551584 32) Choose correct correlation interpretation: (a) Positive correlation of 0.83- strong corelation. Percentage of variation explained...
 Q1 (30 points) Consider Problem 11.45, Page 637. Please note that for this problem the data will be entered in R as follows: #Enter data on x = Dose Level of Drug, and y = Potency of Drug (Problem 11.45, page 637) x<-c(2, 2, 2, 4, 4, 8, 8, 16, 16, 16, 32, 32, 64, 64, 64) y<-c(5, 7, 3, 10, 14, 15, 17, 20, 21, 19, 23, 29, 28, 31, 30) For this problem, answer the following questions. In...
Most questions answered within 3 hours.
-
Where is the error in this code sequence?
String s1 = "Hello";
String s2 = "ello";...
asked 11 months ago -
Financial data for Joel de Paris, Inc., for last year
follow:
Joel de Paris, Inc.
Balance...
asked 11 months ago -
Consider this reaction:
Al2(SO4)3 (aq)+ BaCl3
(aq) Al2Cl6 (aq)- +
3BaSO4(s) . What is the...
asked 11 months ago -
Suppose that Savneet is considering increasing her
recent random sample from 20 car rentals to 40...
asked 11 months ago -
Trucks arrive at an unloading terminal at an average rate of 120
per hour.
Trucks arrive...
asked 11 months ago -
Why are methanol and ethanol completely soluble in water while
octanol is not very little soluble....
asked 11 months ago -
A facilities manager at a university reads in a research report
that the mean amount of...
asked 11 months ago -
When the CuSO4 is rehydrated by adding water to the anhydrous
compound, is this an endothermic...
asked 11 months ago -
A ray of sunlight is passing from diamond into crown glass; the
angle of incidence is...
asked 11 months ago -
A block of mass 0.249 kg is placed on top of a light, vertical
spring of...
asked 11 months ago -
how do the kidneys compensate in the presences of acidosis
a) trigger hyperventilate
b) reserve acid...
asked 11 months ago -
Question 501 pts
The rental rate of capital to the firm increases. Which of the
following...
asked 11 months ago