
Homework Answers
1. Solution
% myFunction.m
% defining myFunction for question 1
function f = myFunction(x)
f = tan(x).^2 + x -2;
end
% driver.m
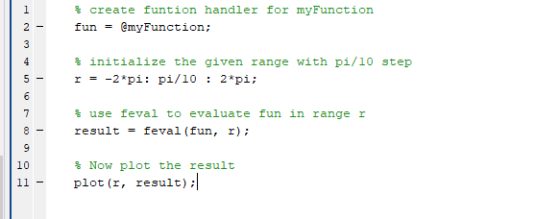
% create funtion handler for myFunction
fun = @myFunction;
% initialize the given range with pi/10 step
r = -2*pi: pi/10 : 2*pi;
% use feval to evaluate fun in range r
result = feval(fun, r);
% Now plot the result
plot(r, result);
% SCREENSHOTS
% myFunction.m

% driver.m
%OUTPUT (plot of results)

Add Answer to:
i need Matlab code asap
Write a program that evaluates the function f(x) = tan’x +...
Write a MATLAB script to plot the function of f(x) given by: Write a MATLAB script...
 Write a MATLAB script to plot the function of f(x) given by:
 f(x) = integral x^2 - pi^2/4 x > pi/2 8 * cos x -pi/2 lessthanorequalto x lessthanorequalto pi/2 pi^2/4 - x^2 x < -pi/2
Write a MATLAB script to plot the function of f(x) given by:
Write a MATLAB script to plot the function of f(x) given by: f(x) = integral x^2 - pi^2/4 x > pi/2 8 * cos x -pi/2 lessthanorequalto x lessthanorequalto pi/2 pi^2/4 - x^2 x < -pi/2
A5.2. Write a matlab program to find out the root of equation f (x)-x*-3x - 1, using false-positi...
 numerical method lab
A5.2. Write a matlab program to find out the root of equation f (x)-x*-3x - 1, using false-position method. Use initial and upper guesses -1 and 1.5 False Position method: xr-Xu Explanation of False Position f(x)(x-xu) Hints change) xu far-feval (foxr) ; root-0.3294 Xr
A5.2. Write a matlab program to find out the root of equation f (x)-x*-3x - 1, using false-position method. Use initial and upper guesses -1 and 1.5 False Position method: xr-Xu Explanation of...
numerical method lab
A5.2. Write a matlab program to find out the root of equation f (x)-x*-3x - 1, using false-position method. Use initial and upper guesses -1 and 1.5 False Position method: xr-Xu Explanation of False Position f(x)(x-xu) Hints change) xu far-feval (foxr) ; root-0.3294 Xr
A5.2. Write a matlab program to find out the root of equation f (x)-x*-3x - 1, using false-position method. Use initial and upper guesses -1 and 1.5 False Position method: xr-Xu Explanation of...
In MATLAB please Consider the nonlinear function: y = f(x) = x3 cos x a. Plot...
 In MATLAB please
Consider the nonlinear function: y = f(x) = x3 cos x a. Plot y as a function of x as x is varied between -67 and 67. In this plot mark all the locations of x where y = 0. Make sure to get all the roots in this range. You may need to zoom in to some areas of the plot. These locations are some of the roots of the above equation. b. Use the fzero...
In MATLAB please
Consider the nonlinear function: y = f(x) = x3 cos x a. Plot y as a function of x as x is varied between -67 and 67. In this plot mark all the locations of x where y = 0. Make sure to get all the roots in this range. You may need to zoom in to some areas of the plot. These locations are some of the roots of the above equation. b. Use the fzero...
Don't use fplot command. Matlab code. Write out code please, don't make it a screenshot. 2....
 Don't use fplot command. Matlab code. Write out code please,
don't make it a screenshot.
2. Use the subplot command to make two plots of the function f(x) = (x + 1)(x - 2)(2x – 0.25) - et one graph for 0 < x <3 and the other for 3 < x < 6. Use a logarithmic scale for the y-axis. Include a plot title (for each subplot), and label both aris(for each subplot).
Don't use fplot command. Matlab code. Write out code please,
don't make it a screenshot.
2. Use the subplot command to make two plots of the function f(x) = (x + 1)(x - 2)(2x – 0.25) - et one graph for 0 < x <3 and the other for 3 < x < 6. Use a logarithmic scale for the y-axis. Include a plot title (for each subplot), and label both aris(for each subplot).
in matlab 4.1.6 Lambert's W function is defined as the inverse of xe. That is, y-W(x)if and only if x = ye, Write a function y=1ambertW(x) that computes W using fzero. Make a plot of W(x) for...
 in matlab
4.1.6 Lambert's W function is defined as the inverse of xe. That is, y-W(x)if and only if x = ye, Write a function y=1ambertW(x) that computes W using fzero. Make a plot of W(x) for Osx34 it is a simple
4.1.6 Lambert's W function is defined as the inverse of xe. That is, y-W(x)if and only if x = ye, Write a function y=1ambertW(x) that computes W using fzero. Make a plot of W(x) for Osx34 it is...
in matlab
4.1.6 Lambert's W function is defined as the inverse of xe. That is, y-W(x)if and only if x = ye, Write a function y=1ambertW(x) that computes W using fzero. Make a plot of W(x) for Osx34 it is a simple
4.1.6 Lambert's W function is defined as the inverse of xe. That is, y-W(x)if and only if x = ye, Write a function y=1ambertW(x) that computes W using fzero. Make a plot of W(x) for Osx34 it is...
by using Matlab R20 16a I need the code and the graph * Write a program...
by using Matlab R20 16a I need the code and the graph * Write a program to plot the derivative of function ?=?.?^−?^?
Please add comments line for matlab and show all step in paper, ASAP. Thanks in advance....
 Please add comments line for matlab and show all step in paper,
ASAP. Thanks in advance.
0.24 Hyperbolic sinusoids-In filter design you will be asked to use hyper bolic functions. In this problem we relate these functions to sinusoids and obtain a definition of these functions so that we can actually plot them (a) Consider computing the cosine of an imaginary number, i.e., use cos(x) 2 let j and find cos(x). The resulting function is called the hyper- bolic cosine...
Please add comments line for matlab and show all step in paper,
ASAP. Thanks in advance.
0.24 Hyperbolic sinusoids-In filter design you will be asked to use hyper bolic functions. In this problem we relate these functions to sinusoids and obtain a definition of these functions so that we can actually plot them (a) Consider computing the cosine of an imaginary number, i.e., use cos(x) 2 let j and find cos(x). The resulting function is called the hyper- bolic cosine...
Q: please solve using matlab code withe comment 1. Write the Matlab code to generate: x...
Q: please solve using matlab code withe comment 1. Write the Matlab code to generate: x = cos(w1*t) + cos(w2*t); where, w1=7; w2=23; t = [0:0.005:2] 2. Plot the signal using sub plot a. in time domain b. in frequency domain 3) Sample the signal under different sampling conditions: a. Ts<1/2fm b. Ts=1/2fm c. Ts>1/2fm 4). Multiple plot: the signal sampled under sampling condition and the signal x a. in time domain b. in frequency domain c. Label and Title...
1. Write a Matlab function, piecewise (), that will calculate and return the value of the...
 1. Write a Matlab function, piecewise (), that will calculate and return the value of the function f(x) defined by: 0<rS3 3<s5 e (x) -cos(3r) 2 sin(r) 2. Write a Matlab script to plot the function f(z) on the interval -3ss8. Ensure the output is sufficiently smooth by declaring z with enough data points. The plot should include the title My Piecewise Function, appropriate axis labels and grid lines.
1. Write a Matlab function, piecewise (), that will calculate and...
1. Write a Matlab function, piecewise (), that will calculate and return the value of the function f(x) defined by: 0<rS3 3<s5 e (x) -cos(3r) 2 sin(r) 2. Write a Matlab script to plot the function f(z) on the interval -3ss8. Ensure the output is sufficiently smooth by declaring z with enough data points. The plot should include the title My Piecewise Function, appropriate axis labels and grid lines.
1. Write a Matlab function, piecewise (), that will calculate and...
Please MATLAB for all coding with good commenting. (20) Consider the function f(x) = e* -...
 Please MATLAB for all coding with good commenting.
(20) Consider the function f(x) = e* - 3x. Using only and exactly the four points on the graph off with x-coordinates -1,0, 1 and 2, use MATLAB's polyfit function to determine a 3' degree polynomial that approximates f on the interval (-1, 2]. Plot the function f(x) and the 360 degree polynomial you have determined on the same set of axes. f must be blue and have a dashed line style,...
Please MATLAB for all coding with good commenting.
(20) Consider the function f(x) = e* - 3x. Using only and exactly the four points on the graph off with x-coordinates -1,0, 1 and 2, use MATLAB's polyfit function to determine a 3' degree polynomial that approximates f on the interval (-1, 2]. Plot the function f(x) and the 360 degree polynomial you have determined on the same set of axes. f must be blue and have a dashed line style,...
 Write a MATLAB script to plot the function of f(x) given by:
 f(x) = integral x^2 - pi^2/4 x > pi/2 8 * cos x -pi/2 lessthanorequalto x lessthanorequalto pi/2 pi^2/4 - x^2 x < -pi/2
Write a MATLAB script to plot the function of f(x) given by:
Write a MATLAB script to plot the function of f(x) given by: f(x) = integral x^2 - pi^2/4 x > pi/2 8 * cos x -pi/2 lessthanorequalto x lessthanorequalto pi/2 pi^2/4 - x^2 x < -pi/2
 numerical method lab
A5.2. Write a matlab program to find out the root of equation f (x)-x*-3x - 1, using false-position method. Use initial and upper guesses -1 and 1.5 False Position method: xr-Xu Explanation of False Position f(x)(x-xu) Hints change) xu far-feval (foxr) ; root-0.3294 Xr
A5.2. Write a matlab program to find out the root of equation f (x)-x*-3x - 1, using false-position method. Use initial and upper guesses -1 and 1.5 False Position method: xr-Xu Explanation of...
numerical method lab
A5.2. Write a matlab program to find out the root of equation f (x)-x*-3x - 1, using false-position method. Use initial and upper guesses -1 and 1.5 False Position method: xr-Xu Explanation of False Position f(x)(x-xu) Hints change) xu far-feval (foxr) ; root-0.3294 Xr
A5.2. Write a matlab program to find out the root of equation f (x)-x*-3x - 1, using false-position method. Use initial and upper guesses -1 and 1.5 False Position method: xr-Xu Explanation of...
 In MATLAB please
Consider the nonlinear function: y = f(x) = x3 cos x a. Plot y as a function of x as x is varied between -67 and 67. In this plot mark all the locations of x where y = 0. Make sure to get all the roots in this range. You may need to zoom in to some areas of the plot. These locations are some of the roots of the above equation. b. Use the fzero...
In MATLAB please
Consider the nonlinear function: y = f(x) = x3 cos x a. Plot y as a function of x as x is varied between -67 and 67. In this plot mark all the locations of x where y = 0. Make sure to get all the roots in this range. You may need to zoom in to some areas of the plot. These locations are some of the roots of the above equation. b. Use the fzero...
 Don't use fplot command. Matlab code. Write out code please,
don't make it a screenshot.
2. Use the subplot command to make two plots of the function f(x) = (x + 1)(x - 2)(2x – 0.25) - et one graph for 0 < x <3 and the other for 3 < x < 6. Use a logarithmic scale for the y-axis. Include a plot title (for each subplot), and label both aris(for each subplot).
Don't use fplot command. Matlab code. Write out code please,
don't make it a screenshot.
2. Use the subplot command to make two plots of the function f(x) = (x + 1)(x - 2)(2x – 0.25) - et one graph for 0 < x <3 and the other for 3 < x < 6. Use a logarithmic scale for the y-axis. Include a plot title (for each subplot), and label both aris(for each subplot).
 in matlab
4.1.6 Lambert's W function is defined as the inverse of xe. That is, y-W(x)if and only if x = ye, Write a function y=1ambertW(x) that computes W using fzero. Make a plot of W(x) for Osx34 it is a simple
4.1.6 Lambert's W function is defined as the inverse of xe. That is, y-W(x)if and only if x = ye, Write a function y=1ambertW(x) that computes W using fzero. Make a plot of W(x) for Osx34 it is...
in matlab
4.1.6 Lambert's W function is defined as the inverse of xe. That is, y-W(x)if and only if x = ye, Write a function y=1ambertW(x) that computes W using fzero. Make a plot of W(x) for Osx34 it is a simple
4.1.6 Lambert's W function is defined as the inverse of xe. That is, y-W(x)if and only if x = ye, Write a function y=1ambertW(x) that computes W using fzero. Make a plot of W(x) for Osx34 it is...
 Please add comments line for matlab and show all step in paper,
ASAP. Thanks in advance.
0.24 Hyperbolic sinusoids-In filter design you will be asked to use hyper bolic functions. In this problem we relate these functions to sinusoids and obtain a definition of these functions so that we can actually plot them (a) Consider computing the cosine of an imaginary number, i.e., use cos(x) 2 let j and find cos(x). The resulting function is called the hyper- bolic cosine...
Please add comments line for matlab and show all step in paper,
ASAP. Thanks in advance.
0.24 Hyperbolic sinusoids-In filter design you will be asked to use hyper bolic functions. In this problem we relate these functions to sinusoids and obtain a definition of these functions so that we can actually plot them (a) Consider computing the cosine of an imaginary number, i.e., use cos(x) 2 let j and find cos(x). The resulting function is called the hyper- bolic cosine...
 1. Write a Matlab function, piecewise (), that will calculate and return the value of the function f(x) defined by: 0<rS3 3<s5 e (x) -cos(3r) 2 sin(r) 2. Write a Matlab script to plot the function f(z) on the interval -3ss8. Ensure the output is sufficiently smooth by declaring z with enough data points. The plot should include the title My Piecewise Function, appropriate axis labels and grid lines.
1. Write a Matlab function, piecewise (), that will calculate and...
1. Write a Matlab function, piecewise (), that will calculate and return the value of the function f(x) defined by: 0<rS3 3<s5 e (x) -cos(3r) 2 sin(r) 2. Write a Matlab script to plot the function f(z) on the interval -3ss8. Ensure the output is sufficiently smooth by declaring z with enough data points. The plot should include the title My Piecewise Function, appropriate axis labels and grid lines.
1. Write a Matlab function, piecewise (), that will calculate and...
 Please MATLAB for all coding with good commenting.
(20) Consider the function f(x) = e* - 3x. Using only and exactly the four points on the graph off with x-coordinates -1,0, 1 and 2, use MATLAB's polyfit function to determine a 3' degree polynomial that approximates f on the interval (-1, 2]. Plot the function f(x) and the 360 degree polynomial you have determined on the same set of axes. f must be blue and have a dashed line style,...
Please MATLAB for all coding with good commenting.
(20) Consider the function f(x) = e* - 3x. Using only and exactly the four points on the graph off with x-coordinates -1,0, 1 and 2, use MATLAB's polyfit function to determine a 3' degree polynomial that approximates f on the interval (-1, 2]. Plot the function f(x) and the 360 degree polynomial you have determined on the same set of axes. f must be blue and have a dashed line style,...
Most questions answered within 3 hours.
-
Where is the error in this code sequence?
String s1 = "Hello";
String s2 = "ello";...
asked 11 months ago -
Financial data for Joel de Paris, Inc., for last year
follow:
Joel de Paris, Inc.
Balance...
asked 11 months ago -
Consider this reaction:
Al2(SO4)3 (aq)+ BaCl3
(aq) Al2Cl6 (aq)- +
3BaSO4(s) . What is the...
asked 11 months ago -
Suppose that Savneet is considering increasing her
recent random sample from 20 car rentals to 40...
asked 11 months ago -
Trucks arrive at an unloading terminal at an average rate of 120
per hour.
Trucks arrive...
asked 11 months ago -
Why are methanol and ethanol completely soluble in water while
octanol is not very little soluble....
asked 11 months ago -
A facilities manager at a university reads in a research report
that the mean amount of...
asked 11 months ago -
When the CuSO4 is rehydrated by adding water to the anhydrous
compound, is this an endothermic...
asked 11 months ago -
A ray of sunlight is passing from diamond into crown glass; the
angle of incidence is...
asked 11 months ago -
A block of mass 0.249 kg is placed on top of a light, vertical
spring of...
asked 11 months ago -
how do the kidneys compensate in the presences of acidosis
a) trigger hyperventilate
b) reserve acid...
asked 11 months ago -
Question 501 pts
The rental rate of capital to the firm increases. Which of the
following...
asked 11 months ago