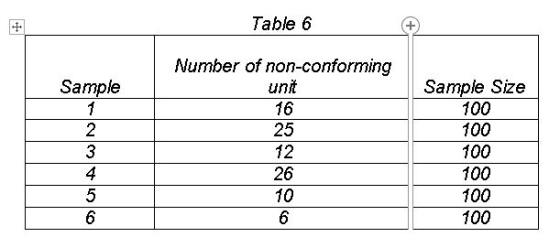
Consider a set of products is produced with 100 sample size per batch. An observation for the non-conforming unit as shown in Table 6. Construct a P-Chart and deduce whether the process is in control or not.
Homework Answers

 From the chart above the process is in
control.
From the chart above the process is in
control.
Have a good day.enjoy?
Add Answer to:
Consider a set of products is produced with 100 sample size
per batch. An observation for...
2- The number of nonconforming switches in Number of Number of samples of size 150 are...
 2- The number of nonconforming switches in Number of Number of samples of size 150 are shown in the Table. Sample Construct a fraction nonconforming control chart (p-chart) for these data. Does the process appear to be in control? If not assume that assignable causes can be found 4 for all points outside the control limits and calculate the revised control limits. Nonconforming Switches Sample Number Nonconforniro Switches Number 12 13 14 15 16 17 18 19 0 15 10
Control Chart Question 1 Given the following sets of data, construct an appropriate control chart and...
 Control Chart Question 1 Given the following sets of data, construct an appropriate control chart and recommend suitable control limits for future data. 1st Data Set Fraction non- #of defectives conforming # np d 1 10 2 8 3 12 4 5 10 6 11 7 9 10 12 10 11 11 31 12 32 13 10 14 8 15 12 16 10 17 11 18 9 19 10 20 8 sample size, n 300 =
Part 3 [35 Marks 3- The number of nonconforming switches in samples of size 75 are...
 Part 3 [35 Marks 3- The number of nonconforming switches in samples of size 75 are shown in Table 3. [20 Marks] Table 3 Number of Nonconforming Assemblies Number of Sample Nonconforming Number Sample Number Assemblies 6 7 11 1 15 12 2 0 13 1 3 9 14 3 4 5 15 6 5 1 16 8 4 17 10 7 5 18 5 7 19 2 9 12 20 7 10 (a) Construct a fraction nonconforming control chart...
13.11 The metal body for a spark plug is made by a combination of cold extrusion...
 13.11 The metal body for a spark plug is made by a combination of cold extrusion and machining. The occurrence of surface cracking following the extrusion process has been shown by Pareto diagrams to be responsible for producing virtually all of the defective parts. To identify opportunities for process improvement, it was decided to construct p charts for the process. During one shift, 25 samples of size n - 100 were collected and the results shown in the table were...
kon over the past 10 days are given below. Sample size is 100. Day Defectives 1...
 kon over the past 10 days are given below. Sample size is 100. Day Defectives 1 7 2 9 3 9 4 11 5 7 6 8 7 0 8 11 9 13 10 2 a) The upper and lower 3-sigma control chart limits are: UCL, -(enter your response as a number between 0 and 1, rounded to three decimal places). LCL - Center your response as a number between 0 and 1, rounded to three decimal plocos). b) Given...
a production process is considered in control if up to 4% of items produced are defective. samples of size 100 are used for the inspection process. determine the upper and lower control limits for the...
a production process is considered in control if up to 4% of items produced are defective. samples of size 100 are used for the inspection process. determine the upper and lower control limits for the p chart. A. UCL= .0988 LCL=0.0000 B. UCL=.0888 LCL= 0.000 C. UCL= .0788 LCL= .01 D. UCL= 0.0688 LCL= .02
The results of inspection of DNA samples taken over the past 10 days are given below. Sample size is 100. 10 Day Defectives 2 3 4 6 6 0 6 a) The upper and lower 3-sigma control chart limits are: UCLp...
 The results of inspection of DNA samples taken over the past 10 days are given below. Sample size is 100. 10 Day Defectives 2 3 4 6 6 0 6 a) The upper and lower 3-sigma control chart limits are: UCLp(enter your response as a number between 0 and 1, rounded to three decimal places). LCL(enter your response as a number between 0 and 1, rounded to three decimal places). b) Given the limits in part a, is the process...
Consider the following batch flow process consisting of four process steps operated by Anna, Aaron, Emily...
Consider the following batch flow process consisting of four process steps operated by Anna, Aaron, Emily and Mike. Emily’s step requires set-up. Assume the units in a production batch must be moved together between steps. The activity times and setup time are given below: What batch size would you choose so as to maximize the process capacity? a. 5 b. 10 c. 15 d. 20 e. 25 Process Steps operated by Processing Time in min per unit Setup time Anna...
The percentage of faulty computer chips produced by a factory in the Pacific Rim is of...
The percentage of faulty computer chips produced by a factory in the Pacific Rim is of concern to a customer. Rather than wait for the chips to be shipped to the assembly plant in Canada, the customer has sent a group of managers to the supplier’s factory to start statistical process control there. As each batch of chips comes out of the process, the managers collect a sample of 200 for testing. The chart below shows the number of malfunctioning...
2. (20 points) A controlled through the use of a fraction nonconforming chart. Initially, one sample of size taken each day for 10 days, and the results shown in following table are observed. (a)...
 2. (20 points) A controlled through the use of a fraction nonconforming chart. Initially, one sample of size taken each day for 10 days, and the results shown in following table are observed. (a) Establish a control chart to monitor future production. (b) Apply Western Electric Rules to these charts. Is the process in statistical control? process that produces titanium forgings for automobile turbocharger wheels is to be 200 i Day Nonconforming Units 14 15 6 7 8 14 5...
 2- The number of nonconforming switches in Number of Number of samples of size 150 are shown in the Table. Sample Construct a fraction nonconforming control chart (p-chart) for these data. Does the process appear to be in control? If not assume that assignable causes can be found 4 for all points outside the control limits and calculate the revised control limits. Nonconforming Switches Sample Number Nonconforniro Switches Number 12 13 14 15 16 17 18 19 0 15 10
 Control Chart Question 1 Given the following sets of data, construct an appropriate control chart and recommend suitable control limits for future data. 1st Data Set Fraction non- #of defectives conforming # np d 1 10 2 8 3 12 4 5 10 6 11 7 9 10 12 10 11 11 31 12 32 13 10 14 8 15 12 16 10 17 11 18 9 19 10 20 8 sample size, n 300 =
 Part 3 [35 Marks 3- The number of nonconforming switches in samples of size 75 are shown in Table 3. [20 Marks] Table 3 Number of Nonconforming Assemblies Number of Sample Nonconforming Number Sample Number Assemblies 6 7 11 1 15 12 2 0 13 1 3 9 14 3 4 5 15 6 5 1 16 8 4 17 10 7 5 18 5 7 19 2 9 12 20 7 10 (a) Construct a fraction nonconforming control chart...
 13.11 The metal body for a spark plug is made by a combination of cold extrusion and machining. The occurrence of surface cracking following the extrusion process has been shown by Pareto diagrams to be responsible for producing virtually all of the defective parts. To identify opportunities for process improvement, it was decided to construct p charts for the process. During one shift, 25 samples of size n - 100 were collected and the results shown in the table were...
 kon over the past 10 days are given below. Sample size is 100. Day Defectives 1 7 2 9 3 9 4 11 5 7 6 8 7 0 8 11 9 13 10 2 a) The upper and lower 3-sigma control chart limits are: UCL, -(enter your response as a number between 0 and 1, rounded to three decimal places). LCL - Center your response as a number between 0 and 1, rounded to three decimal plocos). b) Given...
 The results of inspection of DNA samples taken over the past 10 days are given below. Sample size is 100. 10 Day Defectives 2 3 4 6 6 0 6 a) The upper and lower 3-sigma control chart limits are: UCLp(enter your response as a number between 0 and 1, rounded to three decimal places). LCL(enter your response as a number between 0 and 1, rounded to three decimal places). b) Given the limits in part a, is the process...
 2. (20 points) A controlled through the use of a fraction nonconforming chart. Initially, one sample of size taken each day for 10 days, and the results shown in following table are observed. (a) Establish a control chart to monitor future production. (b) Apply Western Electric Rules to these charts. Is the process in statistical control? process that produces titanium forgings for automobile turbocharger wheels is to be 200 i Day Nonconforming Units 14 15 6 7 8 14 5...
Most questions answered within 3 hours.
-
Where is the error in this code sequence?
String s1 = "Hello";
String s2 = "ello";...
asked 11 months ago -
Financial data for Joel de Paris, Inc., for last year
follow:
Joel de Paris, Inc.
Balance...
asked 11 months ago -
Consider this reaction:
Al2(SO4)3 (aq)+ BaCl3
(aq) Al2Cl6 (aq)- +
3BaSO4(s) . What is the...
asked 11 months ago -
Suppose that Savneet is considering increasing her
recent random sample from 20 car rentals to 40...
asked 11 months ago -
Trucks arrive at an unloading terminal at an average rate of 120
per hour.
Trucks arrive...
asked 11 months ago -
Why are methanol and ethanol completely soluble in water while
octanol is not very little soluble....
asked 11 months ago -
A facilities manager at a university reads in a research report
that the mean amount of...
asked 11 months ago -
When the CuSO4 is rehydrated by adding water to the anhydrous
compound, is this an endothermic...
asked 11 months ago -
A ray of sunlight is passing from diamond into crown glass; the
angle of incidence is...
asked 11 months ago -
A block of mass 0.249 kg is placed on top of a light, vertical
spring of...
asked 11 months ago -
how do the kidneys compensate in the presences of acidosis
a) trigger hyperventilate
b) reserve acid...
asked 11 months ago -
Question 501 pts
The rental rate of capital to the firm increases. Which of the
following...
asked 11 months ago