pleass help im stuck on this question
Homework Answers
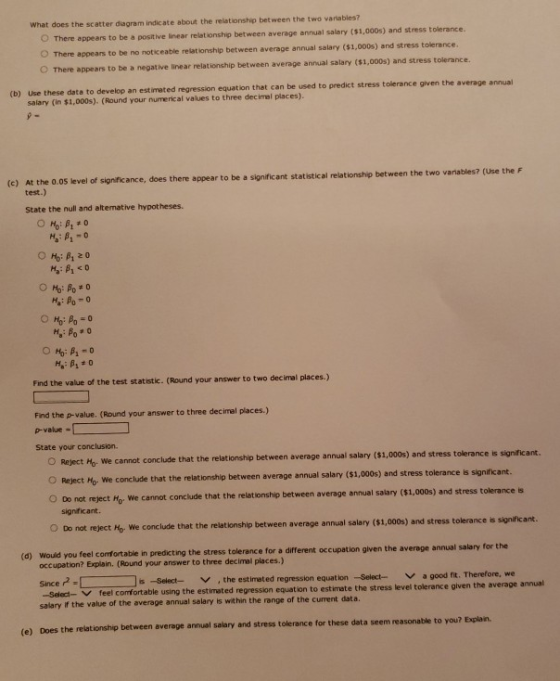
a) The correct scatter plot from the given plots is

Interpretation: There appears to be a negative linear relationship between average salary ($ 1,000) and stress tolerance.
| Average Annual Salary (x) | Stress Tolerance (y) | (x-Mx)^2 | (y-My)^2 | (x-Mx)(y-My) | |
| 1 | 81 | 69 | 31.36 | 9.61 | -17.36 |
| 2 | 96 | 62 | 88.36 | 15.21 | -36.66 |
| 3 | 70 | 67.5 | 275.56 | 2.56 | -26.56 |
| 4 | 70 | 70.3 | 275.56 | 19.36 | -73.04 |
| 5 | 92 | 63.3 | 29.16 | 6.76 | -14.04 |
| 6 | 92 | 69.5 | 29.16 | 12.96 | 19.44 |
| 7 | 100 | 62.8 | 179.56 | 9.61 | -41.54 |
| 8 | 98 | 65.5 | 129.96 | 0.16 | -4.56 |
| 9 | 102 | 60.1 | 237.16 | 33.64 | -89.32 |
| 10 | 65 | 69 | 466.56 | 9.61 | -66.96 |
| Total | 866 | 659 | 1742.4 | 119.48 | -350.6 |

e) Yes, the relationship between average annual salary and sress tolerance for these data seem reasonable because the the slope is significant by using F-test statistic .
Add Answer to:
pleass help im stuck on this question
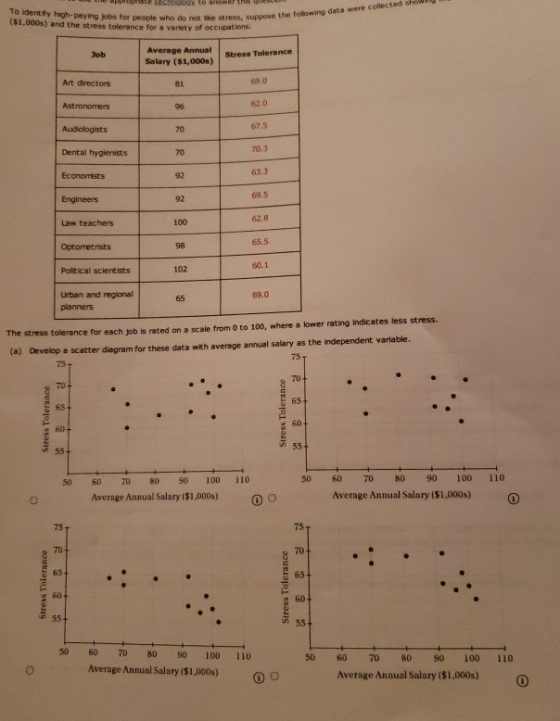
To identify high-paying jobs for people who do not...
To identify high-paying jobs for people that do not like stress, the following data were collected...
 To identify high-paying jobs for people that do not like stress,
the following data were collected showing the average annual salary
($1000) and the stress tolerance for a variety of occupations
(Business Insider, November 8, 2013).
The stress tolerance for each job is rated on a scale from 0 to
100, where a lower rating indicates less stress.
Click on the datafile logo to reference the data.
a. Select a scatter diagram for these data with
average annual salary as...
To identify high-paying jobs for people that do not like stress,
the following data were collected showing the average annual salary
($1000) and the stress tolerance for a variety of occupations
(Business Insider, November 8, 2013).
The stress tolerance for each job is rated on a scale from 0 to
100, where a lower rating indicates less stress.
Click on the datafile logo to reference the data.
a. Select a scatter diagram for these data with
average annual salary as...
on ма m Question Help Refer to the accompanying data set and construct a 90% confidence...
 on ма m Question Help Refer to the accompanying data set and construct a 90% confidence interval estimate of the mean pulse rate of adult females; then do the same for adult males. Compare the results. Click the icon to view the pulse rates for adult females and adult males Construct a 90% confidence interval of the mean pulse rate for adult females. bpmu<bpm (Round to one decimal place as needed.) Construct a 90% confidence interval of the mean pulse...
This Excel file Undergrad Survey shows the data resulting from a survey of 50 undergraduate students...
This Excel file Undergrad Survey shows the data resulting from a survey of 50 undergraduate students at Clemson University. Majors of students in the survey are accounting (A), economics and finance (EF), management (M), marketing (MR), computer information systems (IS), other (O), and undecided (UN). "Number of affiliations" is the number of social networking sites at which the student is registered; "Spending" is the amount spent on textbooks for the current semester. The other variables are self-explanatory. We will assume...
Please answer all questions Question 30 1 pts Solve the problem. To help consumers assess the...
 Please answer all questions
Question 30 1 pts Solve the problem. To help consumers assess the risks they are taking, the Food and Drug Administration (FDA) publishes the amount of nicotine found in all commercial brands of cigarettes. A new cigarette has recently been marketed. The FDA tests on this cigarette yielded mean nicotine content of 24.4 milligrams and standard deviation of 2.2 milligrams for a sample of r9 cigarettes. Construct a 95% confidence interval for the mean nicotine content...
Please answer all questions
Question 30 1 pts Solve the problem. To help consumers assess the risks they are taking, the Food and Drug Administration (FDA) publishes the amount of nicotine found in all commercial brands of cigarettes. A new cigarette has recently been marketed. The FDA tests on this cigarette yielded mean nicotine content of 24.4 milligrams and standard deviation of 2.2 milligrams for a sample of r9 cigarettes. Construct a 95% confidence interval for the mean nicotine content...
help with question 7b 5. What population has: (a) the largest mean height? Population 2 has...
 help with question 7b
5. What population has: (a) the largest mean height? Population 2 has the largest mean height. (b) the largest mean weight? Population 2 has the largest mean weight 6. a. Which population has the most variance in height? Population 1 has the most variance in height. b. Which population has the most variance in weight? Population 1 has the most variance in weight 7. a. Which population is a better representation of the global gene pool?...
help with question 7b
5. What population has: (a) the largest mean height? Population 2 has the largest mean height. (b) the largest mean weight? Population 2 has the largest mean weight 6. a. Which population has the most variance in height? Population 1 has the most variance in height. b. Which population has the most variance in weight? Population 1 has the most variance in weight 7. a. Which population is a better representation of the global gene pool?...
1:When performing a two-tailed test for the difference between means, with Ho:-=0, the hypothesized difference between...
1:When performing a two-tailed test for the difference between means, with Ho:-=0, the hypothesized difference between the two population means is zero. Select one: True False Question 2: If the null hypothesis is - 10 and the alternative hypothesis is - > 10, the appropriate test to use is a lower tail test. Select one: True False Question 3:Suppose it desired to compare two physical education training programs for preadolescent girls. A total of 82 girls are randomely selected, with...
objective question What is the mode and the mean for the following set of numbers? {4,9,8,2,16,4,4,8,9,6}...
 objective question
What is the mode and the mean for the following set of numbers? {4,9,8,2,16,4,4,8,9,6} O A. Mean = 7, mode =8 O B. Mean = 7, mode =4 O C. Mean = 6, mode =8 O D. Mean = 8, mode =9 You are conducting a survey of the people of the United Kingdom to find out how popular the racket sports are. You randomly choose people to call, and make 1,000 phone calls to people scattered across...
objective question
What is the mode and the mean for the following set of numbers? {4,9,8,2,16,4,4,8,9,6} O A. Mean = 7, mode =8 O B. Mean = 7, mode =4 O C. Mean = 6, mode =8 O D. Mean = 8, mode =9 You are conducting a survey of the people of the United Kingdom to find out how popular the racket sports are. You randomly choose people to call, and make 1,000 phone calls to people scattered across...
okay so here is my c++ code and the errors im really stuck on fixing what...
 okay so here is my c++ code and the errors im really stuck on
fixing what i did wrong it seems to be the same repeated
error
our job is to write a menu driven program that can convert to display Morse Code ere is the menu the program should display Menu Alphabet Initials N-Numbers - Punctuations S = User Sentence Q- Quit Enter command the user chooses A your program should use a loop and your morse code printing...
okay so here is my c++ code and the errors im really stuck on
fixing what i did wrong it seems to be the same repeated
error
our job is to write a menu driven program that can convert to display Morse Code ere is the menu the program should display Menu Alphabet Initials N-Numbers - Punctuations S = User Sentence Q- Quit Enter command the user chooses A your program should use a loop and your morse code printing...
does anyone know what High and low group means in this context? i really do not...
 does anyone know what High and low group means in this
context? i really do not understand this article so anyone that
does please explain it to me and what the hugh and low group mean
in the figures.
Received: 21 November 2018 Revised: 27 February 2019 Accepted: 6 March 2019 DOE: 10.1002p28546 ORIGINAL RESEARCnes-highdearee of intra modole connecHvity WILEYa Phypliology ARTICLE Four novel biomarkers for bladder cancer identified by weighted gene coexpression network analysis Zi-Xin Guo | Xiao-Ping Liu...
does anyone know what High and low group means in this
context? i really do not understand this article so anyone that
does please explain it to me and what the hugh and low group mean
in the figures.
Received: 21 November 2018 Revised: 27 February 2019 Accepted: 6 March 2019 DOE: 10.1002p28546 ORIGINAL RESEARCnes-highdearee of intra modole connecHvity WILEYa Phypliology ARTICLE Four novel biomarkers for bladder cancer identified by weighted gene coexpression network analysis Zi-Xin Guo | Xiao-Ping Liu...
This Test: 45 pts pos Find the indicated z-scores shown in the graph Click to view.page...
 This Test: 45 pts pos Find the indicated z-scores shown in the graph Click to view.page 1 of the Standard Normal Table The z-scores are Use a comma to separate answers as needed Round to two decimal places as needed ) Find the indicated probability using the standard normal distribution. P(z > 2.02) Click here to view page 1 of the standard normal table, Click here to view page 2 of the standard normal table P(Z> 2.02)(Round to four decimal...
 To identify high-paying jobs for people that do not like stress,
the following data were collected showing the average annual salary
($1000) and the stress tolerance for a variety of occupations
(Business Insider, November 8, 2013).
The stress tolerance for each job is rated on a scale from 0 to
100, where a lower rating indicates less stress.
Click on the datafile logo to reference the data.
a. Select a scatter diagram for these data with
average annual salary as...
To identify high-paying jobs for people that do not like stress,
the following data were collected showing the average annual salary
($1000) and the stress tolerance for a variety of occupations
(Business Insider, November 8, 2013).
The stress tolerance for each job is rated on a scale from 0 to
100, where a lower rating indicates less stress.
Click on the datafile logo to reference the data.
a. Select a scatter diagram for these data with
average annual salary as...
 on ма m Question Help Refer to the accompanying data set and construct a 90% confidence interval estimate of the mean pulse rate of adult females; then do the same for adult males. Compare the results. Click the icon to view the pulse rates for adult females and adult males Construct a 90% confidence interval of the mean pulse rate for adult females. bpmu<bpm (Round to one decimal place as needed.) Construct a 90% confidence interval of the mean pulse...
 Please answer all questions
Question 30 1 pts Solve the problem. To help consumers assess the risks they are taking, the Food and Drug Administration (FDA) publishes the amount of nicotine found in all commercial brands of cigarettes. A new cigarette has recently been marketed. The FDA tests on this cigarette yielded mean nicotine content of 24.4 milligrams and standard deviation of 2.2 milligrams for a sample of r9 cigarettes. Construct a 95% confidence interval for the mean nicotine content...
Please answer all questions
Question 30 1 pts Solve the problem. To help consumers assess the risks they are taking, the Food and Drug Administration (FDA) publishes the amount of nicotine found in all commercial brands of cigarettes. A new cigarette has recently been marketed. The FDA tests on this cigarette yielded mean nicotine content of 24.4 milligrams and standard deviation of 2.2 milligrams for a sample of r9 cigarettes. Construct a 95% confidence interval for the mean nicotine content...
 help with question 7b
5. What population has: (a) the largest mean height? Population 2 has the largest mean height. (b) the largest mean weight? Population 2 has the largest mean weight 6. a. Which population has the most variance in height? Population 1 has the most variance in height. b. Which population has the most variance in weight? Population 1 has the most variance in weight 7. a. Which population is a better representation of the global gene pool?...
help with question 7b
5. What population has: (a) the largest mean height? Population 2 has the largest mean height. (b) the largest mean weight? Population 2 has the largest mean weight 6. a. Which population has the most variance in height? Population 1 has the most variance in height. b. Which population has the most variance in weight? Population 1 has the most variance in weight 7. a. Which population is a better representation of the global gene pool?...
 objective question
What is the mode and the mean for the following set of numbers? {4,9,8,2,16,4,4,8,9,6} O A. Mean = 7, mode =8 O B. Mean = 7, mode =4 O C. Mean = 6, mode =8 O D. Mean = 8, mode =9 You are conducting a survey of the people of the United Kingdom to find out how popular the racket sports are. You randomly choose people to call, and make 1,000 phone calls to people scattered across...
objective question
What is the mode and the mean for the following set of numbers? {4,9,8,2,16,4,4,8,9,6} O A. Mean = 7, mode =8 O B. Mean = 7, mode =4 O C. Mean = 6, mode =8 O D. Mean = 8, mode =9 You are conducting a survey of the people of the United Kingdom to find out how popular the racket sports are. You randomly choose people to call, and make 1,000 phone calls to people scattered across...
 okay so here is my c++ code and the errors im really stuck on
fixing what i did wrong it seems to be the same repeated
error
our job is to write a menu driven program that can convert to display Morse Code ere is the menu the program should display Menu Alphabet Initials N-Numbers - Punctuations S = User Sentence Q- Quit Enter command the user chooses A your program should use a loop and your morse code printing...
okay so here is my c++ code and the errors im really stuck on
fixing what i did wrong it seems to be the same repeated
error
our job is to write a menu driven program that can convert to display Morse Code ere is the menu the program should display Menu Alphabet Initials N-Numbers - Punctuations S = User Sentence Q- Quit Enter command the user chooses A your program should use a loop and your morse code printing...
 does anyone know what High and low group means in this
context? i really do not understand this article so anyone that
does please explain it to me and what the hugh and low group mean
in the figures.
Received: 21 November 2018 Revised: 27 February 2019 Accepted: 6 March 2019 DOE: 10.1002p28546 ORIGINAL RESEARCnes-highdearee of intra modole connecHvity WILEYa Phypliology ARTICLE Four novel biomarkers for bladder cancer identified by weighted gene coexpression network analysis Zi-Xin Guo | Xiao-Ping Liu...
does anyone know what High and low group means in this
context? i really do not understand this article so anyone that
does please explain it to me and what the hugh and low group mean
in the figures.
Received: 21 November 2018 Revised: 27 February 2019 Accepted: 6 March 2019 DOE: 10.1002p28546 ORIGINAL RESEARCnes-highdearee of intra modole connecHvity WILEYa Phypliology ARTICLE Four novel biomarkers for bladder cancer identified by weighted gene coexpression network analysis Zi-Xin Guo | Xiao-Ping Liu...
 This Test: 45 pts pos Find the indicated z-scores shown in the graph Click to view.page 1 of the Standard Normal Table The z-scores are Use a comma to separate answers as needed Round to two decimal places as needed ) Find the indicated probability using the standard normal distribution. P(z > 2.02) Click here to view page 1 of the standard normal table, Click here to view page 2 of the standard normal table P(Z> 2.02)(Round to four decimal...
Most questions answered within 3 hours.
-
Where is the error in this code sequence?
String s1 = "Hello";
String s2 = "ello";...
asked 10 months ago -
Financial data for Joel de Paris, Inc., for last year
follow:
Joel de Paris, Inc.
Balance...
asked 10 months ago -
Consider this reaction:
Al2(SO4)3 (aq)+ BaCl3
(aq) Al2Cl6 (aq)- +
3BaSO4(s) . What is the...
asked 10 months ago -
Suppose that Savneet is considering increasing her
recent random sample from 20 car rentals to 40...
asked 10 months ago -
Trucks arrive at an unloading terminal at an average rate of 120
per hour.
Trucks arrive...
asked 10 months ago -
Why are methanol and ethanol completely soluble in water while
octanol is not very little soluble....
asked 10 months ago -
A facilities manager at a university reads in a research report
that the mean amount of...
asked 10 months ago -
When the CuSO4 is rehydrated by adding water to the anhydrous
compound, is this an endothermic...
asked 10 months ago -
A ray of sunlight is passing from diamond into crown glass; the
angle of incidence is...
asked 10 months ago -
A block of mass 0.249 kg is placed on top of a light, vertical
spring of...
asked 10 months ago -
how do the kidneys compensate in the presences of acidosis
a) trigger hyperventilate
b) reserve acid...
asked 10 months ago -
Question 501 pts
The rental rate of capital to the firm increases. Which of the
following...
asked 10 months ago