

Homework Answers
Add Answer to:
The accompanying table Multinat Becession provide data fortar, nicotine and carbon monoxide contents in a certain...
data set Nicotine (Y) Tar (X1) CO (X2) 0.8 13 18 0.8 13 18 0.2 1...
 data set
Nicotine (Y)
Tar (X1)
CO (X2)
0.8
13
18
0.8
13
18
0.2
1
2
1.1
18
17
1
16
18
1.1
15
18
1.2
15
14
1.1
15
15
0.9
14
15
0.9
14
14
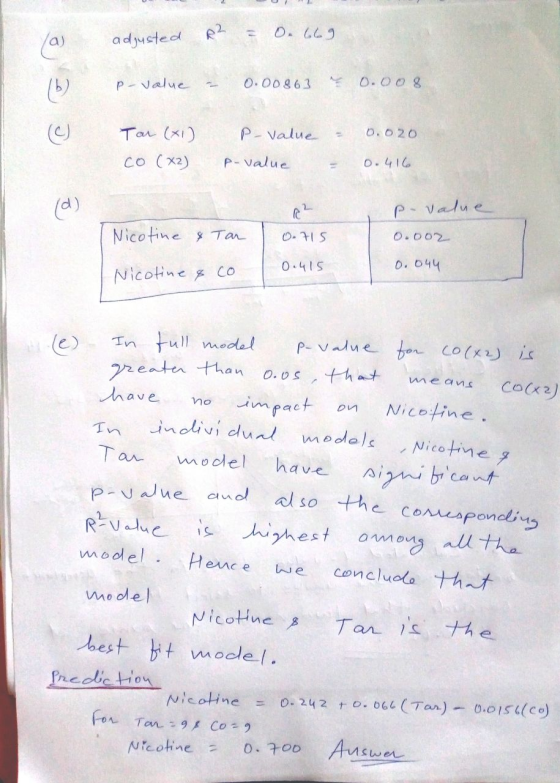
QUESTIONS 9 point The accompanying table, MultiLinear Regression 4, provides data for tar, nicotine, and carbon monoxide (Cco) contents in a certain brand of cigarette. All measurements are in milligrams (mg). Part a) Run the Multilinear Regression Analysis in Excel with both...
data set
Nicotine (Y)
Tar (X1)
CO (X2)
0.8
13
18
0.8
13
18
0.2
1
2
1.1
18
17
1
16
18
1.1
15
18
1.2
15
14
1.1
15
15
0.9
14
15
0.9
14
14
QUESTIONS 9 point The accompanying table, MultiLinear Regression 4, provides data for tar, nicotine, and carbon monoxide (Cco) contents in a certain brand of cigarette. All measurements are in milligrams (mg). Part a) Run the Multilinear Regression Analysis in Excel with both...
6.Use Exponential smoothing forecasts with alpha of 0.1, 0.2, ..., 0.9 to predict March 2019 demand....
6.Use Exponential smoothing forecasts with alpha of 0.1, 0.2, ..., 0.9 to predict March 2019 demand. Identify the value of alpha that results in the lowest MAD. 7.Find the monthly seasonal indices for the demand values using Simple Average (SA) method. Find the de-seasonalized demand values by dividing monthly demand by corresponding seasonal indices. 8.Use regression to perform trend analysis on the de-seasonalized demand values. Is trend analysis suitable for this data? Find MAD and explain the Excel Regression output...
INN MARGIN ROOMS NEAREST OFFICE COLLEGE INCOME DISTTWN 1 61 3203 0.1 549 8 37 12.1 2 34 2810 1.5 496 17.5 39 0.4...
 INN
MARGIN
ROOMS
NEAREST
OFFICE
COLLEGE
INCOME
DISTTWN
1
61
3203
0.1
549
8
37
12.1
2
34
2810
1.5
496
17.5
39
0.4
3
46
2890
1.9
254
20
39
12.2
4
31.9
3422
1
434
15.5
36
2.7
5
57.4
2687
3.4
678
15.5
32
7.9
6
47.5
3080
2.4
488
13.5
31
6.7
7
54.4
2756
1.1
832
14.5
35
6.9
8
46.2
2244
0.7
496
15.5
38
8.9
9
54.1
2862
1.4
809
16.5
33
3...
INN
MARGIN
ROOMS
NEAREST
OFFICE
COLLEGE
INCOME
DISTTWN
1
61
3203
0.1
549
8
37
12.1
2
34
2810
1.5
496
17.5
39
0.4
3
46
2890
1.9
254
20
39
12.2
4
31.9
3422
1
434
15.5
36
2.7
5
57.4
2687
3.4
678
15.5
32
7.9
6
47.5
3080
2.4
488
13.5
31
6.7
7
54.4
2756
1.1
832
14.5
35
6.9
8
46.2
2244
0.7
496
15.5
38
8.9
9
54.1
2862
1.4
809
16.5
33
3...
INN MARGIN ROOMS NEAREST OFFICE COLLEGE INCOME DISTTWN 1 44.2 3471 2.1 523 12 35 9.4...
 INN
MARGIN
ROOMS
NEAREST
OFFICE
COLLEGE
INCOME
DISTTWN
1
44.2
3471
2.1
523
12
35
9.4
2
29.8
3567
1.8
140
13.5
42
5.7
3
38.4
3264
1.6
404
22.5
45
4.4
4
54.4
3234
1.1
649
19.5
35
6.5
5
34.5
2730
4
171
17
41
10.5
6
44.9
3003
3.4
402
15.5
37
4.6
7
46
2341
2
580
23
45
7.4
8
50.2
3021
2.6
572
8.5
33
9.3
9
46
2655
3.2
666
22
40
6.7...
INN
MARGIN
ROOMS
NEAREST
OFFICE
COLLEGE
INCOME
DISTTWN
1
44.2
3471
2.1
523
12
35
9.4
2
29.8
3567
1.8
140
13.5
42
5.7
3
38.4
3264
1.6
404
22.5
45
4.4
4
54.4
3234
1.1
649
19.5
35
6.5
5
34.5
2730
4
171
17
41
10.5
6
44.9
3003
3.4
402
15.5
37
4.6
7
46
2341
2
580
23
45
7.4
8
50.2
3021
2.6
572
8.5
33
9.3
9
46
2655
3.2
666
22
40
6.7...
 data set
Nicotine (Y)
Tar (X1)
CO (X2)
0.8
13
18
0.8
13
18
0.2
1
2
1.1
18
17
1
16
18
1.1
15
18
1.2
15
14
1.1
15
15
0.9
14
15
0.9
14
14
QUESTIONS 9 point The accompanying table, MultiLinear Regression 4, provides data for tar, nicotine, and carbon monoxide (Cco) contents in a certain brand of cigarette. All measurements are in milligrams (mg). Part a) Run the Multilinear Regression Analysis in Excel with both...
data set
Nicotine (Y)
Tar (X1)
CO (X2)
0.8
13
18
0.8
13
18
0.2
1
2
1.1
18
17
1
16
18
1.1
15
18
1.2
15
14
1.1
15
15
0.9
14
15
0.9
14
14
QUESTIONS 9 point The accompanying table, MultiLinear Regression 4, provides data for tar, nicotine, and carbon monoxide (Cco) contents in a certain brand of cigarette. All measurements are in milligrams (mg). Part a) Run the Multilinear Regression Analysis in Excel with both...
 INN
MARGIN
ROOMS
NEAREST
OFFICE
COLLEGE
INCOME
DISTTWN
1
61
3203
0.1
549
8
37
12.1
2
34
2810
1.5
496
17.5
39
0.4
3
46
2890
1.9
254
20
39
12.2
4
31.9
3422
1
434
15.5
36
2.7
5
57.4
2687
3.4
678
15.5
32
7.9
6
47.5
3080
2.4
488
13.5
31
6.7
7
54.4
2756
1.1
832
14.5
35
6.9
8
46.2
2244
0.7
496
15.5
38
8.9
9
54.1
2862
1.4
809
16.5
33
3...
INN
MARGIN
ROOMS
NEAREST
OFFICE
COLLEGE
INCOME
DISTTWN
1
61
3203
0.1
549
8
37
12.1
2
34
2810
1.5
496
17.5
39
0.4
3
46
2890
1.9
254
20
39
12.2
4
31.9
3422
1
434
15.5
36
2.7
5
57.4
2687
3.4
678
15.5
32
7.9
6
47.5
3080
2.4
488
13.5
31
6.7
7
54.4
2756
1.1
832
14.5
35
6.9
8
46.2
2244
0.7
496
15.5
38
8.9
9
54.1
2862
1.4
809
16.5
33
3...
 INN
MARGIN
ROOMS
NEAREST
OFFICE
COLLEGE
INCOME
DISTTWN
1
44.2
3471
2.1
523
12
35
9.4
2
29.8
3567
1.8
140
13.5
42
5.7
3
38.4
3264
1.6
404
22.5
45
4.4
4
54.4
3234
1.1
649
19.5
35
6.5
5
34.5
2730
4
171
17
41
10.5
6
44.9
3003
3.4
402
15.5
37
4.6
7
46
2341
2
580
23
45
7.4
8
50.2
3021
2.6
572
8.5
33
9.3
9
46
2655
3.2
666
22
40
6.7...
INN
MARGIN
ROOMS
NEAREST
OFFICE
COLLEGE
INCOME
DISTTWN
1
44.2
3471
2.1
523
12
35
9.4
2
29.8
3567
1.8
140
13.5
42
5.7
3
38.4
3264
1.6
404
22.5
45
4.4
4
54.4
3234
1.1
649
19.5
35
6.5
5
34.5
2730
4
171
17
41
10.5
6
44.9
3003
3.4
402
15.5
37
4.6
7
46
2341
2
580
23
45
7.4
8
50.2
3021
2.6
572
8.5
33
9.3
9
46
2655
3.2
666
22
40
6.7...
Most questions answered within 3 hours.
-
Where is the error in this code sequence?
String s1 = "Hello";
String s2 = "ello";...
asked 10 months ago -
Financial data for Joel de Paris, Inc., for last year
follow:
Joel de Paris, Inc.
Balance...
asked 10 months ago -
Consider this reaction:
Al2(SO4)3 (aq)+ BaCl3
(aq) Al2Cl6 (aq)- +
3BaSO4(s) . What is the...
asked 10 months ago -
Suppose that Savneet is considering increasing her
recent random sample from 20 car rentals to 40...
asked 10 months ago -
Trucks arrive at an unloading terminal at an average rate of 120
per hour.
Trucks arrive...
asked 10 months ago -
Why are methanol and ethanol completely soluble in water while
octanol is not very little soluble....
asked 10 months ago -
A facilities manager at a university reads in a research report
that the mean amount of...
asked 10 months ago -
When the CuSO4 is rehydrated by adding water to the anhydrous
compound, is this an endothermic...
asked 10 months ago -
A ray of sunlight is passing from diamond into crown glass; the
angle of incidence is...
asked 10 months ago -
A block of mass 0.249 kg is placed on top of a light, vertical
spring of...
asked 10 months ago -
how do the kidneys compensate in the presences of acidosis
a) trigger hyperventilate
b) reserve acid...
asked 10 months ago -
Question 501 pts
The rental rate of capital to the firm increases. Which of the
following...
asked 10 months ago