

Homework Answers

..................

....................
.................
| ΣX | ΣY | Σ(x-x̅)² | Σ(y-ȳ)² | Σ(x-x̅)(y-ȳ) | |
| total sum | 300.00 | 215.00 | 480.00 | 1192.00 | 672.00 |
| mean | 60.00 | 43.00 | SSxx | SSyy | SSxy |
Sample size, n = 5
here, x̅ = Σx / n= 60.000
ȳ = Σy/n = 43.000
SSxx = Σ(x-x̅)² = 480.0000
SSxy= Σ(x-x̅)(y-ȳ) = 672.0
estimated slope , ß1 = SSxy/SSxx = 672/480=
1.4000
intercept,ß0 = y̅-ß1* x̄ = 43- (1.4 )*60=
-41.0000
Regression line is, Ŷ= -41.000 +
( 1.400 )*x
..............
Predicted Y at X= 62
is
Ŷ= -41.00000 +
1.40000 *62= 45.8
................
Please let me know in case of any doubt.
Thanks in advance!
Please upvote!
Add Answer to:
please assist
The following data give the percentage of women working in five companies in the...
The following data give the percentage of women working in five companies in the retail and...
 The following data give the percentage of women working in five companies in the retail and trade industry. The percentage of management jobs held by women in each company is also shown. % Working 6745 73 54 61 % Management 51 2364 4632 (a Develop a scatter diagram for these data with the percentage of women working in the company as the independent variable. 20 20 50 . . 50 20 60 50! 60 50 40 60 50 40 Management...
The following data given the percentage of women working in five companies in the retaul and...
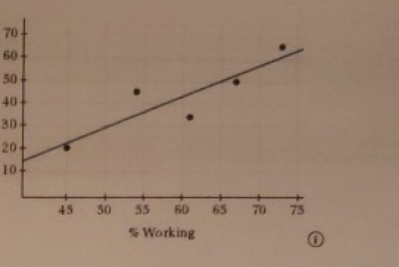
 The following data given the percentage of women working in five companies in the retaul and trade industry. The percentage of management jobs held by women in each company is also shown. % Working 67 45 73 54 61 % 49 21 65 47 33 Management a. Develop a scatter diagram for these data with the percentage of women working in the company as the independent variable. b. What does the scatter diagram developed in part (a) indicate about the...
The following data give the percentage of women working in five companies in the retail and...
The following data give the percentage of women working in five companies in the retail and trade industry. The percentage of management jobs held by women is also shown. % Working 67 45 73 54 61 % Management 49 21 65 47 33 Compute SST, SSR, and SSE. Compute the coefficient of determination, r2. Comment on the goodness of fit. What is the value of the sample correlation coefficient?
QUESTION 9 The following data give the percentage of women working (x) in five companies in...
 QUESTION 9 The following data give the percentage of women working (x) in five companies in the retail and trade industry. The percentage of management jobs (y) held by women in each company is also shown. Given that SSy- 1120 62 40 68 49 56 1936 256 3600 1764 781 15605 8340 3844 1600 4624 2728 640 4080 058 15б8 1074 16 60 28 3136 Sum 190 Based on question (8), which of the following statement is correct for the...
aren 8, 2012) rer these data In eerose 20, data on x-weght(pounds) and y-price ($) for...
 aren 8, 2012) rer these data In eerose 20, data on x-weght(pounds) and y-price ($) for ten roed-racing bikes provided the estimated regression equation SSE 7,102,922.54 and SST-52,120,800. Use the F test to determine whether the weight for data -28574-1435xくBicycling website, M a bike and the price are related at the 05 level of significance. Click on the webfile logo to reference the WEB Calculate the value of the test stotistic (to 1 decimal) 1.4 The p value is ess...
1.2 The following data indicates the percentage of the class actually working at their maths at...
 1.2 The following data indicates the percentage of the class actually working at their maths at different times one hot Friday afternoon: Time since start of lesson (minutes) Percentage of class working y 5 10 15 20 25 30 35 40 20 30 50 85 75 70 40 10 (a) Evaluate the regression line constants using an extended table (8) (b) Construct a scatterplot and determine whether a likely relationship exists between the time since start of lesson (x) and...
Be able to give traversals of the entire tree: Pre-Order: 45, 25, 15, 10, 20, 35,...
 Be able to give traversals of the entire tree: Pre-Order: 45, 25, 15, 10, 20, 35, 30, 40, 65, 55, 50, 60, 75, 70, 80 (extra 45 removed). In-Order: 10, 15, 20, 25, 30, 35, 40, 45, 50, 55, 60, 65, 70, 75, 80 Post-Order: 10, 20, 15, 30, 40, 35, 25, 50, 60, 55, 70, 80, 75, 65, 45
and y Given are five observations for two variables, 7 20 17 13 29 13 48 52 58 a. Choose the correct scatter diagram f...
 and y Given are five observations for two variables, 7 20 17 13 29 13 48 52 58 a. Choose the correct scatter diagram for these data: B. 60- 60 50- 50 40 30- 30 20- 20 10- 10 40 60 x 50 30 60 v 20 10 4C 50 30 10 D C y y 60- 60 50- 50 40- 40 30- 30 60+ 60+ 50- 50- 40+ 40- 30+ 30- 20+ 20+ 10+ 10 10 20 30 40...
Can you please answers these four questions as aoin as possible please and thank you! Given...
 Can you please answers these four questions as aoin as
possible please and thank you!
Given are five observations for two variables, z and y 5 13 20 18 48 57 11 27 a. Choose the corre rect scatter diagram for these data: A. B. 60+ 60 50 50 40 40 30+ 30 20 20 10 10- 10 20 30 40 50 60 x 10 20 30 40 50 60 57 x y 60 60 50+ 50- 40- 40+ 30-...
Can you please answers these four questions as aoin as
possible please and thank you!
Given are five observations for two variables, z and y 5 13 20 18 48 57 11 27 a. Choose the corre rect scatter diagram for these data: A. B. 60+ 60 50 50 40 40 30+ 30 20 20 10 10- 10 20 30 40 50 60 x 10 20 30 40 50 60 57 x y 60 60 50+ 50- 40- 40+ 30-...
8. Following are the 'Handic spectra for two isomeric hromalkancs, A and B (compon following page) with molecular...
 8. Following are the 'Handic spectra for two isomeric hromalkancs, A and B (compon following page) with molecular formula C.H.Br. Draw their structure. (compound B is on the 1Η COCI (Solvent) www wwwwwwwwwwwwww 95 90 85 80 75 70 wwww 60 55 50 45 65 40 35 30 25 20 15 10 CDCI (Solvent) TMS 95 90 RS 80 75 70 65 60 55 50 45 40 35 30 25 20 15 10 5 0 -5 -10
 The following data give the percentage of women working in five companies in the retail and trade industry. The percentage of management jobs held by women in each company is also shown. % Working 6745 73 54 61 % Management 51 2364 4632 (a Develop a scatter diagram for these data with the percentage of women working in the company as the independent variable. 20 20 50 . . 50 20 60 50! 60 50 40 60 50 40 Management...
 The following data given the percentage of women working in five companies in the retaul and trade industry. The percentage of management jobs held by women in each company is also shown. % Working 67 45 73 54 61 % 49 21 65 47 33 Management a. Develop a scatter diagram for these data with the percentage of women working in the company as the independent variable. b. What does the scatter diagram developed in part (a) indicate about the...
 QUESTION 9 The following data give the percentage of women working (x) in five companies in the retail and trade industry. The percentage of management jobs (y) held by women in each company is also shown. Given that SSy- 1120 62 40 68 49 56 1936 256 3600 1764 781 15605 8340 3844 1600 4624 2728 640 4080 058 15б8 1074 16 60 28 3136 Sum 190 Based on question (8), which of the following statement is correct for the...
 aren 8, 2012) rer these data In eerose 20, data on x-weght(pounds) and y-price ($) for ten roed-racing bikes provided the estimated regression equation SSE 7,102,922.54 and SST-52,120,800. Use the F test to determine whether the weight for data -28574-1435xくBicycling website, M a bike and the price are related at the 05 level of significance. Click on the webfile logo to reference the WEB Calculate the value of the test stotistic (to 1 decimal) 1.4 The p value is ess...
 1.2 The following data indicates the percentage of the class actually working at their maths at different times one hot Friday afternoon: Time since start of lesson (minutes) Percentage of class working y 5 10 15 20 25 30 35 40 20 30 50 85 75 70 40 10 (a) Evaluate the regression line constants using an extended table (8) (b) Construct a scatterplot and determine whether a likely relationship exists between the time since start of lesson (x) and...
 Be able to give traversals of the entire tree: Pre-Order: 45, 25, 15, 10, 20, 35, 30, 40, 65, 55, 50, 60, 75, 70, 80 (extra 45 removed). In-Order: 10, 15, 20, 25, 30, 35, 40, 45, 50, 55, 60, 65, 70, 75, 80 Post-Order: 10, 20, 15, 30, 40, 35, 25, 50, 60, 55, 70, 80, 75, 65, 45
 and y Given are five observations for two variables, 7 20 17 13 29 13 48 52 58 a. Choose the correct scatter diagram for these data: B. 60- 60 50- 50 40 30- 30 20- 20 10- 10 40 60 x 50 30 60 v 20 10 4C 50 30 10 D C y y 60- 60 50- 50 40- 40 30- 30 60+ 60+ 50- 50- 40+ 40- 30+ 30- 20+ 20+ 10+ 10 10 20 30 40...
 Can you please answers these four questions as aoin as
possible please and thank you!
Given are five observations for two variables, z and y 5 13 20 18 48 57 11 27 a. Choose the corre rect scatter diagram for these data: A. B. 60+ 60 50 50 40 40 30+ 30 20 20 10 10- 10 20 30 40 50 60 x 10 20 30 40 50 60 57 x y 60 60 50+ 50- 40- 40+ 30-...
Can you please answers these four questions as aoin as
possible please and thank you!
Given are five observations for two variables, z and y 5 13 20 18 48 57 11 27 a. Choose the corre rect scatter diagram for these data: A. B. 60+ 60 50 50 40 40 30+ 30 20 20 10 10- 10 20 30 40 50 60 x 10 20 30 40 50 60 57 x y 60 60 50+ 50- 40- 40+ 30-...
 8. Following are the 'Handic spectra for two isomeric hromalkancs, A and B (compon following page) with molecular formula C.H.Br. Draw their structure. (compound B is on the 1Η COCI (Solvent) www wwwwwwwwwwwwww 95 90 85 80 75 70 wwww 60 55 50 45 65 40 35 30 25 20 15 10 CDCI (Solvent) TMS 95 90 RS 80 75 70 65 60 55 50 45 40 35 30 25 20 15 10 5 0 -5 -10
Most questions answered within 3 hours.
-
Where is the error in this code sequence?
String s1 = "Hello";
String s2 = "ello";...
asked 10 months ago -
Financial data for Joel de Paris, Inc., for last year
follow:
Joel de Paris, Inc.
Balance...
asked 10 months ago -
Consider this reaction:
Al2(SO4)3 (aq)+ BaCl3
(aq) Al2Cl6 (aq)- +
3BaSO4(s) . What is the...
asked 10 months ago -
Suppose that Savneet is considering increasing her
recent random sample from 20 car rentals to 40...
asked 10 months ago -
Trucks arrive at an unloading terminal at an average rate of 120
per hour.
Trucks arrive...
asked 10 months ago -
Why are methanol and ethanol completely soluble in water while
octanol is not very little soluble....
asked 10 months ago -
A facilities manager at a university reads in a research report
that the mean amount of...
asked 10 months ago -
When the CuSO4 is rehydrated by adding water to the anhydrous
compound, is this an endothermic...
asked 10 months ago -
A ray of sunlight is passing from diamond into crown glass; the
angle of incidence is...
asked 10 months ago -
A block of mass 0.249 kg is placed on top of a light, vertical
spring of...
asked 10 months ago -
how do the kidneys compensate in the presences of acidosis
a) trigger hyperventilate
b) reserve acid...
asked 10 months ago -
Question 501 pts
The rental rate of capital to the firm increases. Which of the
following...
asked 10 months ago