

Homework Answers
we want to know if there is difference between the average individual vacation budget of this year and that of last year
for this use Data Analysis tool in excel for t test: Two sample assuming unequal variances. we get the following table
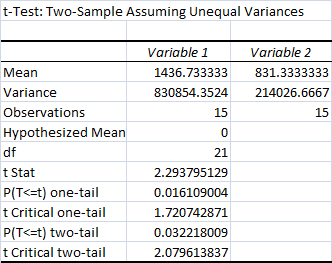
from this table it is observed that  , that is t-statistic =2.2939 is greater than the two sided
critical value. hence it is then concluded that the null
hypothesis is rejected.
, that is t-statistic =2.2939 is greater than the two sided
critical value. hence it is then concluded that the null
hypothesis is rejected.
yes we reject the null hypothesis.
It is concluded that the null hypothesis Ho is rejected. Therefore, there is enough evidence to claim that the average individual vacation budget of this year is different than that of last year, at the 0.05 significance level.
yes there is evidence of difference.
Add Answer to:
Question 9 (1 point) Questions 6-10 is one hypothesis testing problem using an Excel data called...
Question 7 (1 point) Questions 6-10 is one hypothesis testing problem using an Excel data called...
 Question 7 (1 point) Questions 6-10 is one hypothesis testing problem using an Excel data called vacation. We want to know if there is a difference between the average individual vacation budget of this year and that of last year. We collected two independent samples of 15 individuals vacation from each year. We assume population variances are unequal. You already downloaded the data file in Question 6, so you do not have to open it again. Just run a correct...
Question 6 (1 point) Questions 6-10 is one hypothesis testing problem using an Excel data called...
 Question 6 (1 point) Questions 6-10 is one hypothesis testing problem using an Excel data called vacation. Click the file name to download the Excel data file. We want to know if there is a difference between the average individual vacation budget of this year and that of last year. We collected two independent samples of 15 individuals' vacation from each year. We assume population variance are not equal. What is the null hypothesis? O a) H1-H2 = 0 Ob)...
Question 4 (1 point) (Quesitons 1-5 are in one hypothesis testing problem using Teaching Methodology data)....
 Question 4 (1 point) (Quesitons 1-5 are in one hypothesis testing problem using Teaching Methodology data). A teacher of statistics wants to know if a new teaching methodology that includes IT is efficient in terms of increased average score. He took a class with old methodology and a class with new methodology for samples and gave a same test. Once you opened the file in question 1 and ran Excel, you need not open it again. Just use the Excel...
Question 2 (1 point) (Quesitons 1-5 are in one hypothesis problem using Teaching Methodology data) A...
 Question 2 (1 point) (Quesitons 1-5 are in one hypothesis problem using Teaching Methodology data) A teacher of statistics wants to know if a new teaching methodology that includes IT is efficient in terms of increased average score. He took a class with old methodology and a class with new methodology for samples and gave a same test. Once you opened the file in question 1 and ran Excel, you need not open it again. Just use the Excel output...
Question 1 (1 point) ✓ Saved (Quesitons 1-5 are in one hypothesis testing using Teaching Methodology...
 Question 1 (1 point) ✓ Saved (Quesitons 1-5 are in one hypothesis testing using Teaching Methodology data). Click the data file name to download the data A teacher of statistics wants to know if a new teaching methodology that includes IT is efficient in terms of increased average score. He took a class with old methodology and a class with new methodology for samples and gave a same test. Open the file by clicking the file name above. Once you...
Question 2 (1 point) (Quesitons 1-5 are in one hypothesis problem using Teaching Methodology data). A...
 Question 2 (1 point) (Quesitons 1-5 are in one hypothesis problem using Teaching Methodology data). A teacher of statistics wants to know if a new teaching methodology that includes IT is efficient in terms of increased average score. He took a class with old methodology and a class with new methodology for samples and gave a same test. Once you opened the file in question 1 and ran Excel, you need not open it again. Just use the Excel output...
Using the t-Test Exercise Data Set Excel file, Look at the date set of Systolic Blood...
Using the t-Test Exercise Data Set Excel file, Look at the date set of Systolic Blood Pressure Normal Weight/Systolic Blood Pressure Obese Write a null hypothesis for the comparison (use the null hypothesis template). Also, write a directional hypothesis that reflects the anticipated outcome. Conduct a t-test two-sample assuming unequal variances using Excel. Interpret the Excel result (was it significant, what was the critical t-value, what was the calculated t-value, what should be done with the null hypothesis—accept or reject)....
2. Testing two population means using Excel Aa Aa Consider two independent random variables x and...
 2. Testing two population means using Excel Aa Aa Consider two independent random variables x and y. The variable x follows a normal distribution with an unknown population mean ux and a unknown standard deviation of ox. The variable y also follows a normal distribution with an unknown population mean py and a unknown standard deviation of oy. Independent random samples are drawn from each population To answer the questions that follow, download an Excel spreadsheet containing observed values of...
Assignment 3: Hypothesis Testing for the Population Mean The purpose of this activity is to give...
 Assignment 3: Hypothesis Testing for the Population
Mean
The purpose of this activity is to give you guided practice in
going through the process of a t-test for the population mean, and
teach you how to carry out this test using statistical
software.
Background:
A group of 75 college students from a certain liberal arts
college were randomly sampled and asked about the number of
alcoholic drinks they have in a typical week. The file containing
the data is linked...
Assignment 3: Hypothesis Testing for the Population
Mean
The purpose of this activity is to give you guided practice in
going through the process of a t-test for the population mean, and
teach you how to carry out this test using statistical
software.
Background:
A group of 75 college students from a certain liberal arts
college were randomly sampled and asked about the number of
alcoholic drinks they have in a typical week. The file containing
the data is linked...
 Question 7 (1 point) Questions 6-10 is one hypothesis testing problem using an Excel data called vacation. We want to know if there is a difference between the average individual vacation budget of this year and that of last year. We collected two independent samples of 15 individuals vacation from each year. We assume population variances are unequal. You already downloaded the data file in Question 6, so you do not have to open it again. Just run a correct...
 Question 6 (1 point) Questions 6-10 is one hypothesis testing problem using an Excel data called vacation. Click the file name to download the Excel data file. We want to know if there is a difference between the average individual vacation budget of this year and that of last year. We collected two independent samples of 15 individuals' vacation from each year. We assume population variance are not equal. What is the null hypothesis? O a) H1-H2 = 0 Ob)...
 Question 4 (1 point) (Quesitons 1-5 are in one hypothesis testing problem using Teaching Methodology data). A teacher of statistics wants to know if a new teaching methodology that includes IT is efficient in terms of increased average score. He took a class with old methodology and a class with new methodology for samples and gave a same test. Once you opened the file in question 1 and ran Excel, you need not open it again. Just use the Excel...
 Question 2 (1 point) (Quesitons 1-5 are in one hypothesis problem using Teaching Methodology data) A teacher of statistics wants to know if a new teaching methodology that includes IT is efficient in terms of increased average score. He took a class with old methodology and a class with new methodology for samples and gave a same test. Once you opened the file in question 1 and ran Excel, you need not open it again. Just use the Excel output...
 Question 1 (1 point) ✓ Saved (Quesitons 1-5 are in one hypothesis testing using Teaching Methodology data). Click the data file name to download the data A teacher of statistics wants to know if a new teaching methodology that includes IT is efficient in terms of increased average score. He took a class with old methodology and a class with new methodology for samples and gave a same test. Open the file by clicking the file name above. Once you...
 Question 2 (1 point) (Quesitons 1-5 are in one hypothesis problem using Teaching Methodology data). A teacher of statistics wants to know if a new teaching methodology that includes IT is efficient in terms of increased average score. He took a class with old methodology and a class with new methodology for samples and gave a same test. Once you opened the file in question 1 and ran Excel, you need not open it again. Just use the Excel output...
 2. Testing two population means using Excel Aa Aa Consider two independent random variables x and y. The variable x follows a normal distribution with an unknown population mean ux and a unknown standard deviation of ox. The variable y also follows a normal distribution with an unknown population mean py and a unknown standard deviation of oy. Independent random samples are drawn from each population To answer the questions that follow, download an Excel spreadsheet containing observed values of...
 Assignment 3: Hypothesis Testing for the Population
Mean
The purpose of this activity is to give you guided practice in
going through the process of a t-test for the population mean, and
teach you how to carry out this test using statistical
software.
Background:
A group of 75 college students from a certain liberal arts
college were randomly sampled and asked about the number of
alcoholic drinks they have in a typical week. The file containing
the data is linked...
Assignment 3: Hypothesis Testing for the Population
Mean
The purpose of this activity is to give you guided practice in
going through the process of a t-test for the population mean, and
teach you how to carry out this test using statistical
software.
Background:
A group of 75 college students from a certain liberal arts
college were randomly sampled and asked about the number of
alcoholic drinks they have in a typical week. The file containing
the data is linked...
Most questions answered within 3 hours.
-
Where is the error in this code sequence?
String s1 = "Hello";
String s2 = "ello";...
asked 10 months ago -
Financial data for Joel de Paris, Inc., for last year
follow:
Joel de Paris, Inc.
Balance...
asked 10 months ago -
Consider this reaction:
Al2(SO4)3 (aq)+ BaCl3
(aq) Al2Cl6 (aq)- +
3BaSO4(s) . What is the...
asked 10 months ago -
Suppose that Savneet is considering increasing her
recent random sample from 20 car rentals to 40...
asked 10 months ago -
Trucks arrive at an unloading terminal at an average rate of 120
per hour.
Trucks arrive...
asked 10 months ago -
Why are methanol and ethanol completely soluble in water while
octanol is not very little soluble....
asked 10 months ago -
A facilities manager at a university reads in a research report
that the mean amount of...
asked 10 months ago -
When the CuSO4 is rehydrated by adding water to the anhydrous
compound, is this an endothermic...
asked 10 months ago -
A ray of sunlight is passing from diamond into crown glass; the
angle of incidence is...
asked 10 months ago -
A block of mass 0.249 kg is placed on top of a light, vertical
spring of...
asked 10 months ago -
how do the kidneys compensate in the presences of acidosis
a) trigger hyperventilate
b) reserve acid...
asked 10 months ago -
Question 501 pts
The rental rate of capital to the firm increases. Which of the
following...
asked 10 months ago