please be as clear as possible, take note of units and significant figures. thanks for the help
Homework Answers


Add Answer to:
please be as clear as possible, take note of units and
significant figures. thanks for the...
Please be as clear as possible, needs work and theorems explained/noted. No excel please, urgent thanks...
 Please be as clear as possible, needs work and theorems
explained/noted. No excel please, urgent thanks
Textbook - Applied Statistics and Probability for Engineers by
Montgomery, 6th Edition
PART 1. For each of the following statements, circle the letter “T” if it is true, and “F” if it is false. TF If events A and B are mutually exclusive, they must be independent. т F P[A B C] P[CB] P[B] = P[CAB] P[AB] P[B]. T F If the 95% confidence...
Please be as clear as possible, needs work and theorems
explained/noted. No excel please, urgent thanks
Textbook - Applied Statistics and Probability for Engineers by
Montgomery, 6th Edition
PART 1. For each of the following statements, circle the letter “T” if it is true, and “F” if it is false. TF If events A and B are mutually exclusive, they must be independent. т F P[A B C] P[CB] P[B] = P[CAB] P[AB] P[B]. T F If the 95% confidence...
Please be as clear as possible. Textbook - Applied Statistics and Probability for Engineers by Montgomery,...
 Please be as clear as possible.
Textbook - Applied Statistics and Probability for Engineers by
Montgomery, 6th Edition
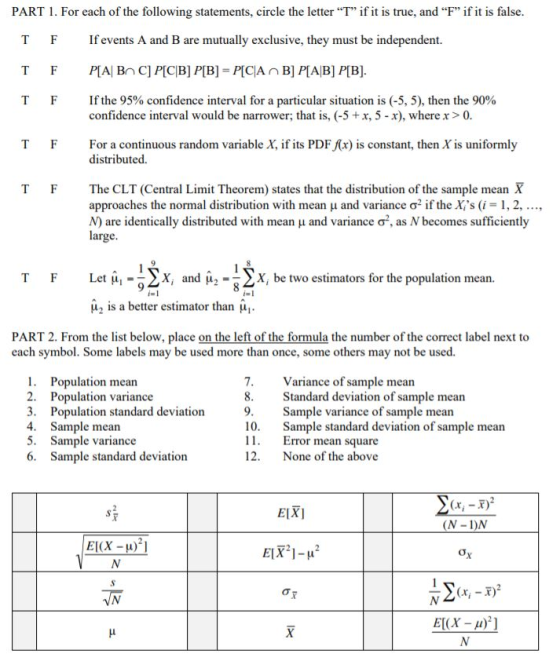
PART 1. For each of the following statements, circle the letter “T” if it is true, and “F” if it is false. TF If events A and B are mutually exclusive, they must be independent. т F P[A B C] P[CB] P[B] = P[CAB] P[AB] P[B]. T F If the 95% confidence interval for a particular situation is (-5,5), then the 90%...
Please be as clear as possible.
Textbook - Applied Statistics and Probability for Engineers by
Montgomery, 6th Edition
PART 1. For each of the following statements, circle the letter “T” if it is true, and “F” if it is false. TF If events A and B are mutually exclusive, they must be independent. т F P[A B C] P[CB] P[B] = P[CAB] P[AB] P[B]. T F If the 95% confidence interval for a particular situation is (-5,5), then the 90%...
please be as clear as possible, take note of units and significant figures. thanks for the...
 please be as clear as possible, take note of units and
significant figures. thanks for the help
An engineer performed N= 20 tests to assess the load capacity of a new anchoring device. The measured load capacities are as follows (in kN): 11.0 20.0 24.0 13.0 16.0 24.0 18.0 7.0 20.0 22.0 17.0 18.0 28.0 27.0 20.0 15.0 12.0 11.0 31.0 28.0 After having assessed that the load capacity is normally distributed, the engineer wants to determine some statistics of...
please be as clear as possible, take note of units and
significant figures. thanks for the help
An engineer performed N= 20 tests to assess the load capacity of a new anchoring device. The measured load capacities are as follows (in kN): 11.0 20.0 24.0 13.0 16.0 24.0 18.0 7.0 20.0 22.0 17.0 18.0 28.0 27.0 20.0 15.0 12.0 11.0 31.0 28.0 After having assessed that the load capacity is normally distributed, the engineer wants to determine some statistics of...
12. As the number of degrees ot trdom ort d n s the the t distribution...
 12. As the number of degrees ot trdom ort d n s the the t distribution andd the standard nomal dist becomes larger b becomes smalter stays the same huctuates. d. 13. In interval esionation, thet distribution is applicatle ondy when a. the population has a mean of tess than 30 b. the sample standard deviation is used to estimate the population standard deviation the variance of the population is known d. the mean of the population is unknown. C....
1. In simple linear regression analysis, we assume that the variance of the independent variable (X)...
1. In simple linear regression analysis, we assume that the variance of the independent variable (X) is equal to the variance of the dependent variable (Y) True False 2. The standard deviation of the sampling distribution of the sample mean is the same as the population standard deviation. True False 3. If n=20 and p=.4, then the mean of the binomial distribution is 8 True False 4. If a population is known to be normally distributed, then it follows that...
need help with the problems listed below For a random sample of n = 124 U.S....
 need help with the problems listed below
For a random sample of n = 124 U.S. cities the mean growing season length was x = 190.7 days. The population standard deviation is o = 42.8 days. Assuming the variable is normally distributed, find the 98% confidence interval (including units) of the population mean. State the distribution used. Give all digits provided by the calculator for the confidence interval. <p>Distribution used:</p> <p>Confidence interval:</p> For a sample of n = 8 randomly...
need help with the problems listed below
For a random sample of n = 124 U.S. cities the mean growing season length was x = 190.7 days. The population standard deviation is o = 42.8 days. Assuming the variable is normally distributed, find the 98% confidence interval (including units) of the population mean. State the distribution used. Give all digits provided by the calculator for the confidence interval. <p>Distribution used:</p> <p>Confidence interval:</p> For a sample of n = 8 randomly...
Which of the following statements is true? The t-distribution with 1 degree of freedom is equivalent...
Which of the following statements is true? The t-distribution with 1 degree of freedom is equivalent to the standard normal distribution. When division by a factor of n-1 is used, the sample variance s2 is an unbiased estimator of the population variance σ2. If a hypothesis test is conducted at the 5% significance level, then a p-value of 0.087 would lead the researcher to reject H0. A 99% z-based confidence interval of the population mean μ based on a sample...
A simple random sample of size n is drawn from a population that is normally distributed....
 A simple random sample of size n is drawn from a population that is normally distributed. The sample mean, x, is found to be 106, and the sample standard deviation, s, is found to be 10. (a) Construct a 90% confidence interval about u if the sample size, n, is 22. (b) Construct a 90% confidence interval about u if the sample size, n, is 27. (c) Construct a 99% confidence interval about u if the sample size, n, is...
True or False? The higher the confidence level, the narrower is the confidence interval for the...
 True or False? The higher the confidence level, the narrower is the confidence interval for the mean. Select an answer The most efficient point estimator for the population mean ù is the sample median . Select an answer • To reduce the width of a confidence interval, we can increase the sample size n. Select an answer • As long as the population is normal with variance o’, the statistic (n-1) S2 has a Chi-squared 02 distribution with n degrees...
If there is a recommended calculator or excel/ti-calculator formula please provide. Thanks! A random sample of...
 If there is a recommended calculator or excel/ti-calculator
formula please provide. Thanks!
A random sample of n measurements was selected from a population with unknown mean u and standard deviation o = 15 for each of the situations in parts a through d. Calculate a 99% confidence interval for u for each of these situations. a. n=50, x=31 b. n=250, x= 112 c. n= 120, x = 16 d. n= 120, x=5.21 e. Is the assumption that the underlying population...
If there is a recommended calculator or excel/ti-calculator
formula please provide. Thanks!
A random sample of n measurements was selected from a population with unknown mean u and standard deviation o = 15 for each of the situations in parts a through d. Calculate a 99% confidence interval for u for each of these situations. a. n=50, x=31 b. n=250, x= 112 c. n= 120, x = 16 d. n= 120, x=5.21 e. Is the assumption that the underlying population...
 Please be as clear as possible, needs work and theorems
explained/noted. No excel please, urgent thanks
Textbook - Applied Statistics and Probability for Engineers by
Montgomery, 6th Edition
PART 1. For each of the following statements, circle the letter “T” if it is true, and “F” if it is false. TF If events A and B are mutually exclusive, they must be independent. т F P[A B C] P[CB] P[B] = P[CAB] P[AB] P[B]. T F If the 95% confidence...
Please be as clear as possible, needs work and theorems
explained/noted. No excel please, urgent thanks
Textbook - Applied Statistics and Probability for Engineers by
Montgomery, 6th Edition
PART 1. For each of the following statements, circle the letter “T” if it is true, and “F” if it is false. TF If events A and B are mutually exclusive, they must be independent. т F P[A B C] P[CB] P[B] = P[CAB] P[AB] P[B]. T F If the 95% confidence...
 Please be as clear as possible.
Textbook - Applied Statistics and Probability for Engineers by
Montgomery, 6th Edition
PART 1. For each of the following statements, circle the letter “T” if it is true, and “F” if it is false. TF If events A and B are mutually exclusive, they must be independent. т F P[A B C] P[CB] P[B] = P[CAB] P[AB] P[B]. T F If the 95% confidence interval for a particular situation is (-5,5), then the 90%...
Please be as clear as possible.
Textbook - Applied Statistics and Probability for Engineers by
Montgomery, 6th Edition
PART 1. For each of the following statements, circle the letter “T” if it is true, and “F” if it is false. TF If events A and B are mutually exclusive, they must be independent. т F P[A B C] P[CB] P[B] = P[CAB] P[AB] P[B]. T F If the 95% confidence interval for a particular situation is (-5,5), then the 90%...
 please be as clear as possible, take note of units and
significant figures. thanks for the help
An engineer performed N= 20 tests to assess the load capacity of a new anchoring device. The measured load capacities are as follows (in kN): 11.0 20.0 24.0 13.0 16.0 24.0 18.0 7.0 20.0 22.0 17.0 18.0 28.0 27.0 20.0 15.0 12.0 11.0 31.0 28.0 After having assessed that the load capacity is normally distributed, the engineer wants to determine some statistics of...
please be as clear as possible, take note of units and
significant figures. thanks for the help
An engineer performed N= 20 tests to assess the load capacity of a new anchoring device. The measured load capacities are as follows (in kN): 11.0 20.0 24.0 13.0 16.0 24.0 18.0 7.0 20.0 22.0 17.0 18.0 28.0 27.0 20.0 15.0 12.0 11.0 31.0 28.0 After having assessed that the load capacity is normally distributed, the engineer wants to determine some statistics of...
 12. As the number of degrees ot trdom ort d n s the the t distribution andd the standard nomal dist becomes larger b becomes smalter stays the same huctuates. d. 13. In interval esionation, thet distribution is applicatle ondy when a. the population has a mean of tess than 30 b. the sample standard deviation is used to estimate the population standard deviation the variance of the population is known d. the mean of the population is unknown. C....
 need help with the problems listed below
For a random sample of n = 124 U.S. cities the mean growing season length was x = 190.7 days. The population standard deviation is o = 42.8 days. Assuming the variable is normally distributed, find the 98% confidence interval (including units) of the population mean. State the distribution used. Give all digits provided by the calculator for the confidence interval. <p>Distribution used:</p> <p>Confidence interval:</p> For a sample of n = 8 randomly...
need help with the problems listed below
For a random sample of n = 124 U.S. cities the mean growing season length was x = 190.7 days. The population standard deviation is o = 42.8 days. Assuming the variable is normally distributed, find the 98% confidence interval (including units) of the population mean. State the distribution used. Give all digits provided by the calculator for the confidence interval. <p>Distribution used:</p> <p>Confidence interval:</p> For a sample of n = 8 randomly...
 A simple random sample of size n is drawn from a population that is normally distributed. The sample mean, x, is found to be 106, and the sample standard deviation, s, is found to be 10. (a) Construct a 90% confidence interval about u if the sample size, n, is 22. (b) Construct a 90% confidence interval about u if the sample size, n, is 27. (c) Construct a 99% confidence interval about u if the sample size, n, is...
 True or False? The higher the confidence level, the narrower is the confidence interval for the mean. Select an answer The most efficient point estimator for the population mean ù is the sample median . Select an answer • To reduce the width of a confidence interval, we can increase the sample size n. Select an answer • As long as the population is normal with variance o’, the statistic (n-1) S2 has a Chi-squared 02 distribution with n degrees...
 If there is a recommended calculator or excel/ti-calculator
formula please provide. Thanks!
A random sample of n measurements was selected from a population with unknown mean u and standard deviation o = 15 for each of the situations in parts a through d. Calculate a 99% confidence interval for u for each of these situations. a. n=50, x=31 b. n=250, x= 112 c. n= 120, x = 16 d. n= 120, x=5.21 e. Is the assumption that the underlying population...
If there is a recommended calculator or excel/ti-calculator
formula please provide. Thanks!
A random sample of n measurements was selected from a population with unknown mean u and standard deviation o = 15 for each of the situations in parts a through d. Calculate a 99% confidence interval for u for each of these situations. a. n=50, x=31 b. n=250, x= 112 c. n= 120, x = 16 d. n= 120, x=5.21 e. Is the assumption that the underlying population...
Most questions answered within 3 hours.
-
Where is the error in this code sequence?
String s1 = "Hello";
String s2 = "ello";...
asked 10 months ago -
Financial data for Joel de Paris, Inc., for last year
follow:
Joel de Paris, Inc.
Balance...
asked 10 months ago -
Consider this reaction:
Al2(SO4)3 (aq)+ BaCl3
(aq) Al2Cl6 (aq)- +
3BaSO4(s) . What is the...
asked 10 months ago -
Suppose that Savneet is considering increasing her
recent random sample from 20 car rentals to 40...
asked 10 months ago -
Trucks arrive at an unloading terminal at an average rate of 120
per hour.
Trucks arrive...
asked 10 months ago -
Why are methanol and ethanol completely soluble in water while
octanol is not very little soluble....
asked 10 months ago -
A facilities manager at a university reads in a research report
that the mean amount of...
asked 10 months ago -
When the CuSO4 is rehydrated by adding water to the anhydrous
compound, is this an endothermic...
asked 10 months ago -
A ray of sunlight is passing from diamond into crown glass; the
angle of incidence is...
asked 10 months ago -
A block of mass 0.249 kg is placed on top of a light, vertical
spring of...
asked 10 months ago -
how do the kidneys compensate in the presences of acidosis
a) trigger hyperventilate
b) reserve acid...
asked 10 months ago -
Question 501 pts
The rental rate of capital to the firm increases. Which of the
following...
asked 10 months ago