
Homework Answers


Add Answer to:
A
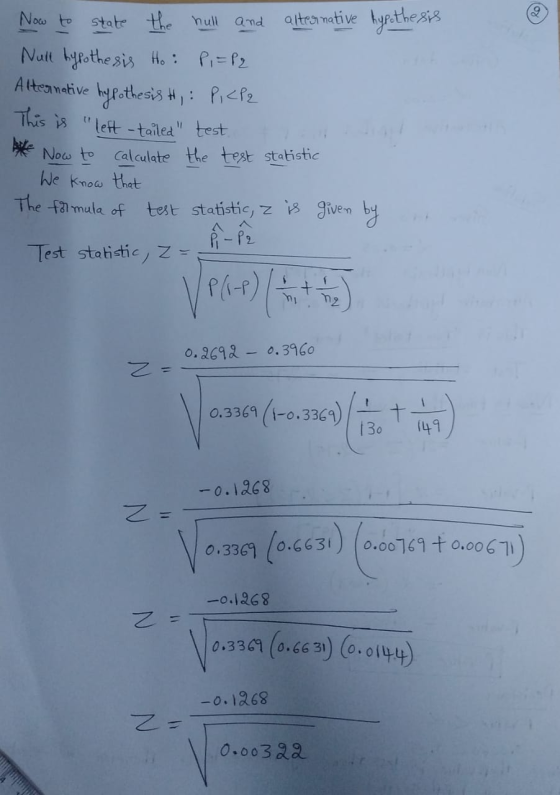
random sample of n1=130 individuals results in x1=35 successes. An
independent sample of n2=149 individuals...
A random sample of n = 137 individuals results in X1 = 45 successes. An independent...
 A random sample of n = 137 individuals results in X1 = 45 successes. An independent sample of n2 = 151 individuals results in X2 = 58 successes. Does this represent sufficient evidence to conclude that p; <P2 at the x = 0.01 level of significance? Click here to view the standard normal distribution table (page 1). Click here to view the standard normal distribution table (page 2). Click here to view the table of critical t-values. Click here to...
Independent random samples of size n1=38 and n2=86 observations, were selected from two populations. The samples...
Independent random samples of size n1=38 and n2=86 observations, were selected from two populations. The samples from populations 1 and 2 produced x1=18 and x2=13 successes, respectively. Define p1 and p2 to be the proportion of successes in populations 1 and 2, respectively. We would like to test the following hypotheses: H0:p1=p2 versus H1:p1≠p2 (a)To test H0 versus H1, which inference procedure should you use? A. Two-sample z procedure B. One-sample z procedure C. One-sample t procedure D. Two-sample t...
Independent random samples of n1 = 120 and n2 = 120 observations were randomly selected from...
Independent random samples of n1 = 120 and n2 = 120 observations were randomly selected from binomial populations 1 and 2, respectively. Sample 1 had 62 successes, and sample 2 had 67 successes. You wish to perform a hypothesis test to determine if there is a difference in the sample proportions p1 and p2. (a) State the null and alternative hypotheses. - H0: (p1 − p2) = 0 versus Ha: (p1 − p2) ≠ 0 - H0: (p1 − p2)...
For one binomial experiment, n1 = 75 binomial trials produced r1 = 60 successes. For a...
For one binomial experiment, n1 = 75 binomial trials produced r1 = 60 successes. For a second independent binomial experiment, n2 = 100 binomial trials produced r2 = 85 successes. At the 5% level of significance, test the claim that the probabilities of success for the two binomial experiments differ. (a) Compute the pooled probability of success for the two experiments. (Round your answer to three decimal places.) (b) Check Requirements: What distribution does the sample test statistic follow? Explain....
In a test for the difference between two proportions, the sample sizes were n1=68 and n2=76...
In a test for the difference between two proportions, the sample sizes were n1=68 and n2=76 , and the numbers of successes in each sample were x1=41 and x2=25 . A test is made of the hypothesis Ho:p1=p2 versus H1:P1>p2 are the assumptions satisfied in order to do this test?Explain. B) Find the test statistics value C) Can you reject the null hypothesis at the a=0.01 significance level? Use Ti-84 for calculations please.
17. A random sample of n, 133 individuals results in xy +39 successes. An independent sample...
 17. A random sample of n, 133 individuals results in xy +39 successes. An independent sample of ny - 147 individuals results in X - 58 successes. Does this represent sufficient evidence to conclude that P1 P2 at the a=0.01 level of significance? Click here to view the standard normal distribution table (page 1). Click here to view the standard normal distribution table (page 2). Click here to view the table of critical t-values. Click here to view the chi-square...
14. Use the following information to complete steps (a) through (d) below. A random sample of...
 14. Use the following information to complete steps (a) through (d) below. A random sample of n = 135 individuals results in x1 = 40 successes. An independent sample of n2 = 140 individuals results in X2 = 60 successes. Does this represent sufficient evidence to conclude that p1 <P2 at the a=0.05 level of significance? (a) What type of test should be used? O A. A hypothesis test regarding the difference between two population proportions from independent samples. OB....
Construct a 95% confidence interval for p1 - p2. The sample statistics listed below are from independent samples. Sample statistics: n1 = 100, x1 = 35, n2 = 60, x2 = 50 A) (-0.141, 0.208) B) (-0.871,...
Construct a 95% confidence interval for p1 - p2. The sample statistics listed below are from independent samples. Sample statistics: n1 = 100, x1 = 35, n2 = 60, x2 = 50 A) (-0.141, 0.208) B) (-0.871, 0.872) C) (-2.391, 3.112) D) (-1.341, 1.781)
Given two independent random samples with the following results: n1=305 x1=127 n2=194 x2=124 Can it be...
Given two independent random samples with the following results: n1=305 x1=127 n2=194 x2=124 Can it be concluded that there is a difference between the two population proportions? Use a significance level of α=0.05 for the test. State the null and alternative hypotheses for the test. Find the values of the two sample proportions, pˆ1 and pˆ2. Round your answers to three decimal places. Compute the weighted estimate of p, p‾‾. Round your answer to three decimal places. (p bar) Compute...
Consider the following hypothesis statement using α= 0.10 and the following data from two independent samples. Complete parts a and b below. X1 = 66 Ho P1-p2 20 x2 = 70 n2 = 130 H: P-P20 n1 = 125 Cli...
 Consider the following hypothesis statement using α= 0.10 and the following data from two independent samples. Complete parts a and b below. X1 = 66 Ho P1-p2 20 x2 = 70 n2 = 130 H: P-P20 n1 = 125 Click here to view page 1 of the standard normal table Click here to view page 2 of the standard normal table. a. Calculate the appropriate test statistic and interpret the result. What is the test statistic? (Round to two decimal...
 A random sample of n = 137 individuals results in X1 = 45 successes. An independent sample of n2 = 151 individuals results in X2 = 58 successes. Does this represent sufficient evidence to conclude that p; <P2 at the x = 0.01 level of significance? Click here to view the standard normal distribution table (page 1). Click here to view the standard normal distribution table (page 2). Click here to view the table of critical t-values. Click here to...
 17. A random sample of n, 133 individuals results in xy +39 successes. An independent sample of ny - 147 individuals results in X - 58 successes. Does this represent sufficient evidence to conclude that P1 P2 at the a=0.01 level of significance? Click here to view the standard normal distribution table (page 1). Click here to view the standard normal distribution table (page 2). Click here to view the table of critical t-values. Click here to view the chi-square...
 14. Use the following information to complete steps (a) through (d) below. A random sample of n = 135 individuals results in x1 = 40 successes. An independent sample of n2 = 140 individuals results in X2 = 60 successes. Does this represent sufficient evidence to conclude that p1 <P2 at the a=0.05 level of significance? (a) What type of test should be used? O A. A hypothesis test regarding the difference between two population proportions from independent samples. OB....
 Consider the following hypothesis statement using α= 0.10 and the following data from two independent samples. Complete parts a and b below. X1 = 66 Ho P1-p2 20 x2 = 70 n2 = 130 H: P-P20 n1 = 125 Click here to view page 1 of the standard normal table Click here to view page 2 of the standard normal table. a. Calculate the appropriate test statistic and interpret the result. What is the test statistic? (Round to two decimal...
Most questions answered within 3 hours.
-
Where is the error in this code sequence?
String s1 = "Hello";
String s2 = "ello";...
asked 11 months ago -
Financial data for Joel de Paris, Inc., for last year
follow:
Joel de Paris, Inc.
Balance...
asked 11 months ago -
Consider this reaction:
Al2(SO4)3 (aq)+ BaCl3
(aq) Al2Cl6 (aq)- +
3BaSO4(s) . What is the...
asked 11 months ago -
Suppose that Savneet is considering increasing her
recent random sample from 20 car rentals to 40...
asked 11 months ago -
Trucks arrive at an unloading terminal at an average rate of 120
per hour.
Trucks arrive...
asked 11 months ago -
Why are methanol and ethanol completely soluble in water while
octanol is not very little soluble....
asked 11 months ago -
A facilities manager at a university reads in a research report
that the mean amount of...
asked 11 months ago -
When the CuSO4 is rehydrated by adding water to the anhydrous
compound, is this an endothermic...
asked 11 months ago -
A ray of sunlight is passing from diamond into crown glass; the
angle of incidence is...
asked 11 months ago -
A block of mass 0.249 kg is placed on top of a light, vertical
spring of...
asked 11 months ago -
how do the kidneys compensate in the presences of acidosis
a) trigger hyperventilate
b) reserve acid...
asked 11 months ago -
Question 501 pts
The rental rate of capital to the firm increases. Which of the
following...
asked 11 months ago