Consider two independent random samples with the following results:n 1 =165 x 1 =104 n 2...
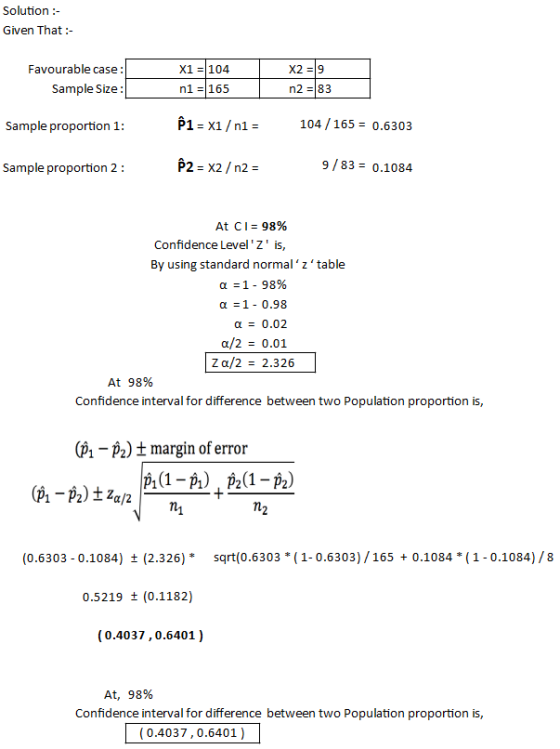
Consider two independent random samples with the following results:n 1 =165 x 1 =104 n 2 =83 x 2 =9 Use this data to find the 98% confidence interval for the true difference between the population proportions.
Homework Answers
Add Answer to:
Consider two independent random samples with the following
results:n 1 =165 x 1 =104 n 2...
Consider two independent random samples with the following results: n = 532 n2 = 730 X...
 Consider two independent random samples with the following results: n = 532 n2 = 730 X = 390 X2 = 139 Use this data to find the 90 % confidence interval for the true difference between the population proportions. Show supporting work for each ste that follows Step 2 of 3: Find the margin of error. Round your answer to six decimal places. Answer 5 Points Tables Keypad
15 Correct Given two independent random samples with the following results: n = 13 = 142...
 15 Correct Given two independent random samples with the following results: n = 13 = 142 12 = 165 $ = 13 Use this data to find the 98% confidence interval for the true difference between the population means. Assume that the population variances are equal and that the two populations are normally distributed Copy Data Step 1 of 3 : Find the point estimate that should be used in constructing the confidence interval. Answer How to enter your answer...
01:28:54 Consider two independent random samples with the following results: n1 = 136 n2 = 235...
 01:28:54 Consider two independent random samples with the following results: n1 = 136 n2 = 235 Use this data to find the 98 % confidence interval for the true difference between the population proportions Copy Data Step 1 of 3: Find the point estimate that should be used in constructing the confidence interval. Round your answer to three decimal places. 2 Points KeypadTables Answer (How to Enter) ^ 빠 .com/Portal/Test/test taketest T0 to search up
Given two independent random samples with the following results: n1=399x1=267 n2=360x2=162 Use this data to find...
Given two independent random samples with the following results: n1=399x1=267 n2=360x2=162 Use this data to find the 98% confidence interval for the true difference between the population proportions. Step 4 of 4 : Construct the 98% confidence interval. Round your answers to three decimal places
Given two independent random samples with the following results: n1=510x1=231 n2=728x2=139 Use this data to find...
Given two independent random samples with the following results: n1=510x1=231 n2=728x2=139 Use this data to find the 98% confidence interval for the true difference between the population proportions. Step 1 of 4 : Find the values of the two sample proportions, pˆ1 and pˆ2. Round your answers to three decimal places
Consider two independent random samples with the following results: n1=123pˆ1=0.48 n2=367pˆ2=0.63 Use this data to find...
Consider two independent random samples with the following results: n1=123pˆ1=0.48 n2=367pˆ2=0.63 Use this data to find the 80% confidence interval for the true difference between the population proportions. Copy Data Step 1 of 3 : Find the point estimate that should be used in constructing the confidence interval. Step 2 of 3: Find the value of the margin of error. Round your answer to six decimal places. Step 3 of 3: Construct the 80% confidence interval. Round your answers to...
Consider the following results for two independent random samples taken from two populations. Sample 1 Sample...
Consider the following results for two independent random samples taken from two populations. Sample 1 Sample 2 n 1 = 40 n 2 = 35 x 1 = 13.8 x 2 = 11.3 σ 1 = 2.5 σ 2 = 3 What is the point estimate of the difference between the two population means? (to 1 decimal) Provide a 90% confidence interval for the difference between the two population means (to 2 decimals). Use z-table. ( , ) Provide a...
Given two independent random samples with the following results: n1 297 n2 93 p1 0.67 p2 0.41 Use this data to find the 98% confidence interval for the true difference between the populati...
Given two independent random samples with the following results: n1 297 n2 93 p1 0.67 p2 0.41 Use this data to find the 98% confidence interval for the true difference between the population proportions. Step 1 of 3: Find the critical value that should be used in constructing the confidence interval. Step 2 of 3: Find the value of the standard error. Round your answer to three decimal places. Step 3 of 3: Construct the 98% confidence interval. Round your...
Consider the following results for independent samples taken from two populations. Sample 1 Sample2 2 200...
 Consider the following results for independent samples taken from two populations. Sample 1 Sample2 2 200 P2 0.31 P1 0.48 a. What is the point estimate of the difference between the two population proportions (to 2 decimals)? b. Develop a 90% confidence interval for the difference between the two population proportions (to 4 decimals. Usez-table. c. Develop a 95% confidence interval for the difference between the two population proportions (to 4 decimals. Use z-table. to to
Consider the following results for independent samples taken from two populations. Sample 1 Sample 2 n1...
Consider the following results for independent samples taken from two populations. Sample 1 Sample 2 n1 = 400 n2= 300 p1= 0.49 p2= 0.36 a. What is the point estimate of the difference between the two population proportions (to 2 decimals)? b. Develop a 90% confidence interval for the difference between the two population proportions (to 4 decimals). Use z-table. c. Develop a 95% confidence interval for the difference between the two population proportions (to 4 decimals). Use z-table.
 Consider two independent random samples with the following results: n = 532 n2 = 730 X = 390 X2 = 139 Use this data to find the 90 % confidence interval for the true difference between the population proportions. Show supporting work for each ste that follows Step 2 of 3: Find the margin of error. Round your answer to six decimal places. Answer 5 Points Tables Keypad
 15 Correct Given two independent random samples with the following results: n = 13 = 142 12 = 165 $ = 13 Use this data to find the 98% confidence interval for the true difference between the population means. Assume that the population variances are equal and that the two populations are normally distributed Copy Data Step 1 of 3 : Find the point estimate that should be used in constructing the confidence interval. Answer How to enter your answer...
 01:28:54 Consider two independent random samples with the following results: n1 = 136 n2 = 235 Use this data to find the 98 % confidence interval for the true difference between the population proportions Copy Data Step 1 of 3: Find the point estimate that should be used in constructing the confidence interval. Round your answer to three decimal places. 2 Points KeypadTables Answer (How to Enter) ^ 빠 .com/Portal/Test/test taketest T0 to search up
 Consider the following results for independent samples taken from two populations. Sample 1 Sample2 2 200 P2 0.31 P1 0.48 a. What is the point estimate of the difference between the two population proportions (to 2 decimals)? b. Develop a 90% confidence interval for the difference between the two population proportions (to 4 decimals. Usez-table. c. Develop a 95% confidence interval for the difference between the two population proportions (to 4 decimals. Use z-table. to to
Most questions answered within 3 hours.
-
Where is the error in this code sequence?
String s1 = "Hello";
String s2 = "ello";...
asked 11 months ago -
Financial data for Joel de Paris, Inc., for last year
follow:
Joel de Paris, Inc.
Balance...
asked 11 months ago -
Consider this reaction:
Al2(SO4)3 (aq)+ BaCl3
(aq) Al2Cl6 (aq)- +
3BaSO4(s) . What is the...
asked 11 months ago -
Suppose that Savneet is considering increasing her
recent random sample from 20 car rentals to 40...
asked 11 months ago -
Trucks arrive at an unloading terminal at an average rate of 120
per hour.
Trucks arrive...
asked 11 months ago -
Why are methanol and ethanol completely soluble in water while
octanol is not very little soluble....
asked 11 months ago -
A facilities manager at a university reads in a research report
that the mean amount of...
asked 11 months ago -
When the CuSO4 is rehydrated by adding water to the anhydrous
compound, is this an endothermic...
asked 11 months ago -
A ray of sunlight is passing from diamond into crown glass; the
angle of incidence is...
asked 11 months ago -
A block of mass 0.249 kg is placed on top of a light, vertical
spring of...
asked 11 months ago -
how do the kidneys compensate in the presences of acidosis
a) trigger hyperventilate
b) reserve acid...
asked 11 months ago -
Question 501 pts
The rental rate of capital to the firm increases. Which of the
following...
asked 11 months ago