
Homework Answers
a)
Answer:

Explanation:
Exponential regression model
The regression analysis is done in excel by following these steps,
Step 1: Write the data values in excel. The screenshot is shown below,

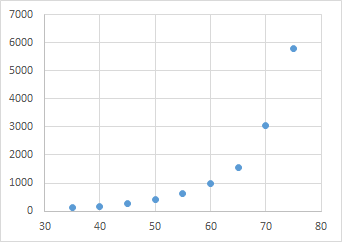
Step 2: Scatter plot: Select the data values then INSERT > Recommended Charts > Scatter XY. The screenshot is shown below,
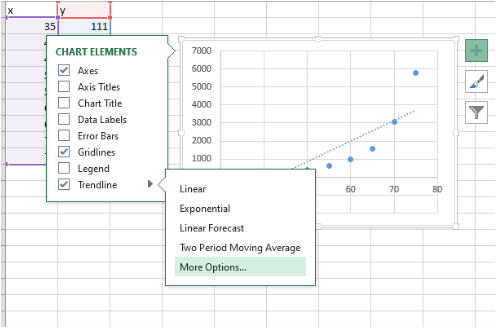
Step 3: To add a Trend line, linear equation, and R-square value in the plot.
Click on Add Chart element> Trendline > More options>OK. The screenshot is shown below,
Step 4: Select Trending Options: Exponential and select Display Equation on the chart, Display R-Squared value on the chart. The screenshot is shown below,


The result is obtained. The screenshot is shown below,

The regression equation is,
b)
Answer:

Explanation:
Quadratic regression model
The regression analysis is done in excel by following these steps,
Step 1: Write the data values in excel.

Step 2: Scatter plot:
Step 3: To add a Trend line, linear equation, and R-square value in the plot.
Click on Add Chart element> Trendline > More options>OK. The screenshot is shown below,
Step 4: Select Trending Options: polynomial, Order: 2, and select Display Equation on the chart, Display R-Squared value on the chart.
The result is obtained. The screenshot is shown below,

The regression equation is,
c)
Exponential function: A

Quadratic function: C

Add Answer to:
please help
Age The folowing table gives the monthly premiums for an insurance policy on people...
Most questions answered within 3 hours.
-
Where is the error in this code sequence?
String s1 = "Hello";
String s2 = "ello";...
asked 10 months ago -
Financial data for Joel de Paris, Inc., for last year
follow:
Joel de Paris, Inc.
Balance...
asked 10 months ago -
Consider this reaction:
Al2(SO4)3 (aq)+ BaCl3
(aq) Al2Cl6 (aq)- +
3BaSO4(s) . What is the...
asked 10 months ago -
Suppose that Savneet is considering increasing her
recent random sample from 20 car rentals to 40...
asked 10 months ago -
Trucks arrive at an unloading terminal at an average rate of 120
per hour.
Trucks arrive...
asked 10 months ago -
Why are methanol and ethanol completely soluble in water while
octanol is not very little soluble....
asked 10 months ago -
A facilities manager at a university reads in a research report
that the mean amount of...
asked 10 months ago -
When the CuSO4 is rehydrated by adding water to the anhydrous
compound, is this an endothermic...
asked 10 months ago -
A ray of sunlight is passing from diamond into crown glass; the
angle of incidence is...
asked 10 months ago -
A block of mass 0.249 kg is placed on top of a light, vertical
spring of...
asked 10 months ago -
how do the kidneys compensate in the presences of acidosis
a) trigger hyperventilate
b) reserve acid...
asked 10 months ago -
Question 501 pts
The rental rate of capital to the firm increases. Which of the
following...
asked 10 months ago