Need helping figuring out part B of the problem.

Homework Answers
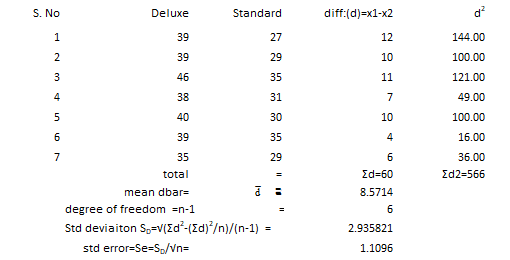
| for 95% CI; and 6 degree of freedom, value of t= | 2.447 | ||
| therefore confidence interval=sample mean -/+ t*std error | |||
| margin of errror =t*std error= | 2.7153 | ||
| lower confidence limit = | 5.86 | ||
| upper confidence limit = | 11.29 | ||
from above 95% confidence interval =(5.86 ,11.29)
(please try 5.85 ,11.28 if this comes wrong)
Add Answer to:
Need helping figuring out part B of the problem.
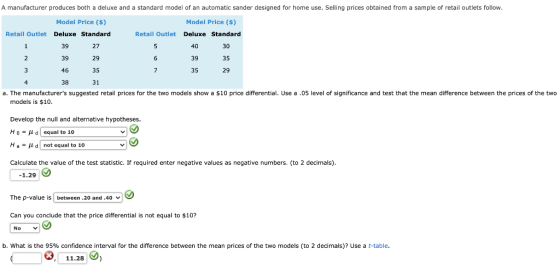
A manufacturer produces both a deluxe and...
The amount of time a plane deviates from its scheduled arrival time is a measure of...
The amount of time a plane deviates from its scheduled arrival time is a measure of performance for airports and airlines, where a positive value means the plane arrived late and a negative value means the plane arrived early. Noah Madbury is an aeronautical engineering student who is writing a report on the amount of time planes deviate from their scheduled arrival time. He would like to show in the report whether the mean deviation of planes from their scheduled...
I ONLY NEED HELP WITH PART OF PART "B" I've figured out the test statistic is...
 I ONLY NEED HELP WITH PART OF PART "B"
I've figured out the test statistic is -1.73 and the degrees of
freedom are 5. However, I'm having a hard time finding the P value
via the chart (which I'm required to learn how to do).I think the
chart immediately bellow this is the one used to find the p-value.
However, I know at least one (or more) of the charts bellow is
what's used. Please let me know which chart...
I ONLY NEED HELP WITH PART OF PART "B"
I've figured out the test statistic is -1.73 and the degrees of
freedom are 5. However, I'm having a hard time finding the P value
via the chart (which I'm required to learn how to do).I think the
chart immediately bellow this is the one used to find the p-value.
However, I know at least one (or more) of the charts bellow is
what's used. Please let me know which chart...
I ONLY NEED HELP WITH PART OF PART "B" I've figured out the test statistic is -1.73 and the degr...
 I ONLY NEED HELP WITH PART OF PART "B"
I've figured out the test statistic is -1.73 and the degrees of
freedom are 5. However, I'm having a hard time finding the P value
via the chart (which I'm required to learn how to do).I think the
chart immediately bellow this is the one used to find the p-value.
However, I know at least one (or more) of the charts bellow is
what's used. Please let me know which chart...
I ONLY NEED HELP WITH PART OF PART "B"
I've figured out the test statistic is -1.73 and the degrees of
freedom are 5. However, I'm having a hard time finding the P value
via the chart (which I'm required to learn how to do).I think the
chart immediately bellow this is the one used to find the p-value.
However, I know at least one (or more) of the charts bellow is
what's used. Please let me know which chart...
Most questions answered within 3 hours.
-
Where is the error in this code sequence?
String s1 = "Hello";
String s2 = "ello";...
asked 10 months ago -
Financial data for Joel de Paris, Inc., for last year
follow:
Joel de Paris, Inc.
Balance...
asked 10 months ago -
Consider this reaction:
Al2(SO4)3 (aq)+ BaCl3
(aq) Al2Cl6 (aq)- +
3BaSO4(s) . What is the...
asked 10 months ago -
Suppose that Savneet is considering increasing her
recent random sample from 20 car rentals to 40...
asked 10 months ago -
Trucks arrive at an unloading terminal at an average rate of 120
per hour.
Trucks arrive...
asked 10 months ago -
Why are methanol and ethanol completely soluble in water while
octanol is not very little soluble....
asked 10 months ago -
A facilities manager at a university reads in a research report
that the mean amount of...
asked 10 months ago -
When the CuSO4 is rehydrated by adding water to the anhydrous
compound, is this an endothermic...
asked 10 months ago -
A ray of sunlight is passing from diamond into crown glass; the
angle of incidence is...
asked 10 months ago -
A block of mass 0.249 kg is placed on top of a light, vertical
spring of...
asked 10 months ago -
how do the kidneys compensate in the presences of acidosis
a) trigger hyperventilate
b) reserve acid...
asked 10 months ago -
Question 501 pts
The rental rate of capital to the firm increases. Which of the
following...
asked 10 months ago