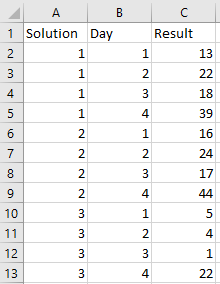
Three different washing solutions are being compared to study their effectiveness in retarding bacteria growth in five-gallon milk containers. The analysis is done in a laboratory, and only three trials can be run on any day. Because days could represent a potential source of variability, the experimenter decides to use a model that reduces experimental error (and hence increases precision) by grouping days into blocks. Observations are taken for four days, values in table below show measurement of effectiveness (bacteria growth rate after using the solution) for each day and solution type.
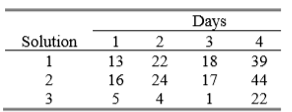
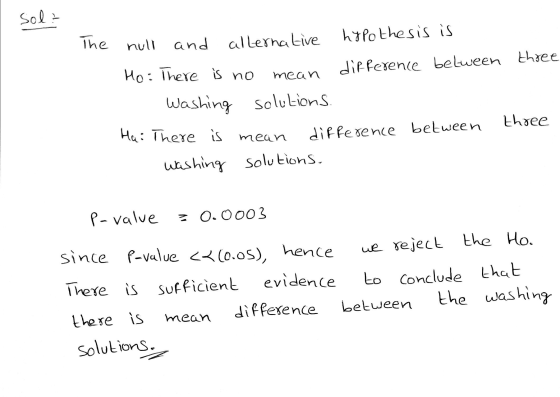
Analyze the data from this experiment (use significance level α = 0.05) using an appropriate model and draw conclusions.
Homework Answers
The output of two way anova factor is

Add Answer to:
Three different washing solutions are being compared to study
their effectiveness in retarding bacteria growth in...
Game Point_Differential Assists Rebounds Turnovers Personal_Fouls 1 15 15 38 11 9 2 36 20 43 &
 Game
Point_Differential Assists
Rebounds Turnovers Personal_Fouls
1 15 15 38
11 9
2 36 20 43
8 13
3 16 21 29
7 13
4 45 22 46
11 11
5 12 11 40
7 22
6 -10 10 31
13 26
7 11 19 45
11 7
8 12 16 32
16 14
9 3 16 27
18 15
10 19 9 34
17 17
11 40 16 41
9 17
12 44 12 29
9 22
13 16 ...
Game
Point_Differential Assists
Rebounds Turnovers Personal_Fouls
1 15 15 38
11 9
2 36 20 43
8 13
3 16 21 29
7 13
4 45 22 46
11 11
5 12 11 40
7 22
6 -10 10 31
13 26
7 11 19 45
11 7
8 12 16 32
16 14
9 3 16 27
18 15
10 19 9 34
17 17
11 40 16 41
9 17
12 44 12 29
9 22
13 16 ...
2. When petrol is pumped into tanks, hydrocarbons escape. To evaluate the effectiveness of pollution controls...
 2. When petrol is pumped into tanks, hydrocarbons escape. To evaluate the effectiveness of pollution controls, experiments were performed. The quantity of hydrocarbons escaping was measured as a function of the tank temperature, the temperature of the petrol pumped in the initial pressure in the tank, and the pressure of the petrol pumped i a) The data is in the same data file as the previous question. Copy it into Minitab and run a regression analysis for the quantity of...
2. When petrol is pumped into tanks, hydrocarbons escape. To evaluate the effectiveness of pollution controls, exp...
 2. When petrol is pumped into tanks, hydrocarbons escape. To evaluate the effectiveness of pollution controls, experiments were performed. The quantity of hydrocarbons escaping was measured as a function of the tank temperature, the temperature of the petrol pumped in the initial pressure in the tank, and the pressure of the petrol pumped i a) The data is in the same data file as the previous question. Copy it into Minitab and run a regression analysis for the quantity of...
Magic Square question for Python
You have this solution in Java, I am interested in this same solution for Python.One interesting application of two-dimensional arrays is magic squares. A magic square is a square matrix in which the sum of every row, every column, and bothdiagonals is the same. Magic squares have been studied for many years, and there are some particularly famous magic squares. In this exercise you will write code todetermine whether a square is magic.You should find that the first, second, and...
Unit6: OPTIMIZING AND CONTROLLING PROCESSES THROUGH STATISTICAL PROCESS CONTROL 1. Define the concept of statistical process...
 Unit6: OPTIMIZING AND CONTROLLING PROCESSES THROUGH STATISTICAL
PROCESS CONTROL
1. Define the concept of statistical process control SPC?
2. What is SPC key element?
3. Solving the following problem (Using x -charts and R
–charts)?
a. Using this data to solve the problem by using X bar chart and
R chart?
b. What is the difference between X bar chart and R chart?
c. Draw the control chart for both X bar chart and R chart?
d. Explain the result?...
Unit6: OPTIMIZING AND CONTROLLING PROCESSES THROUGH STATISTICAL
PROCESS CONTROL
1. Define the concept of statistical process control SPC?
2. What is SPC key element?
3. Solving the following problem (Using x -charts and R
–charts)?
a. Using this data to solve the problem by using X bar chart and
R chart?
b. What is the difference between X bar chart and R chart?
c. Draw the control chart for both X bar chart and R chart?
d. Explain the result?...
A study of reading comprehension in children compared three methods of instruction. The three methods of...
A study of reading comprehension in children compared three methods of instruction. The three methods of instruction are called Basal, DRTA, and Strategies. As is common in such studies, several pretest variables were measured before any instruction was given. One purpose of the pretest was to see if the three groups of children were similar in their comprehension skills. The READING data set described in the Data Appendix gives two pretest measures that were used in this study. Use one-way...
A paper mill uses a control chart to Data on Imperfections in Rolls of Paper monitor...
 A paper mill uses a control chart to Data on Imperfections in Rolls of Paper monitor the imperfection in finished Total Total Ils of paper. Production output is umber Number of Number Number of of Rolls Imper- Day Produced fections Day Produced fections inspected for twenty days, and the resulting data are shown here. Use these data to set up a control chart for 218 4 12 18 14 nonconformities per roll of paper. Does the process appear to be...
A soft drink manufacturer uses fire agents to handle premium distribution for is various products. The marketing director desired to study the timeliness with which the premiums are distributed. Twent...
A soft drink manufacturer uses fire agents to handle premium distribution for is various products. The marketing director desired to study the timeliness with which the premiums are distributed. Twenty transactions for each agent were selected at random and the time lapse (in days) for handling each transaction was determined. The results follow: Agent 1 Agent 2 Agent 3 Agent 4 Agent 5 24 18 10 15 33 24 20 11 13 22 29 20 8 18 28 20 24...
A cosmetic company is interested in testing the effectiveness of a new cream for treating skin...
A cosmetic company is interested in testing the effectiveness of a new cream for treating skin blemishes. It measured the effectiveness of the new cream compared to the leading cream on the market and a placebo. Data below shows the number of blemishes removed after using the cream for 1 week. Assume two-tailed with an α = .05. New Cream Leading Cream Placebo Cream 81 48 18 32 31 49 42 25 33 62 22 19 37 30 24 44...
 Game
Point_Differential Assists
Rebounds Turnovers Personal_Fouls
1 15 15 38
11 9
2 36 20 43
8 13
3 16 21 29
7 13
4 45 22 46
11 11
5 12 11 40
7 22
6 -10 10 31
13 26
7 11 19 45
11 7
8 12 16 32
16 14
9 3 16 27
18 15
10 19 9 34
17 17
11 40 16 41
9 17
12 44 12 29
9 22
13 16 ...
Game
Point_Differential Assists
Rebounds Turnovers Personal_Fouls
1 15 15 38
11 9
2 36 20 43
8 13
3 16 21 29
7 13
4 45 22 46
11 11
5 12 11 40
7 22
6 -10 10 31
13 26
7 11 19 45
11 7
8 12 16 32
16 14
9 3 16 27
18 15
10 19 9 34
17 17
11 40 16 41
9 17
12 44 12 29
9 22
13 16 ...
 2. When petrol is pumped into tanks, hydrocarbons escape. To evaluate the effectiveness of pollution controls, experiments were performed. The quantity of hydrocarbons escaping was measured as a function of the tank temperature, the temperature of the petrol pumped in the initial pressure in the tank, and the pressure of the petrol pumped i a) The data is in the same data file as the previous question. Copy it into Minitab and run a regression analysis for the quantity of...
 2. When petrol is pumped into tanks, hydrocarbons escape. To evaluate the effectiveness of pollution controls, experiments were performed. The quantity of hydrocarbons escaping was measured as a function of the tank temperature, the temperature of the petrol pumped in the initial pressure in the tank, and the pressure of the petrol pumped i a) The data is in the same data file as the previous question. Copy it into Minitab and run a regression analysis for the quantity of...
 Unit6: OPTIMIZING AND CONTROLLING PROCESSES THROUGH STATISTICAL
PROCESS CONTROL
1. Define the concept of statistical process control SPC?
2. What is SPC key element?
3. Solving the following problem (Using x -charts and R
–charts)?
a. Using this data to solve the problem by using X bar chart and
R chart?
b. What is the difference between X bar chart and R chart?
c. Draw the control chart for both X bar chart and R chart?
d. Explain the result?...
Unit6: OPTIMIZING AND CONTROLLING PROCESSES THROUGH STATISTICAL
PROCESS CONTROL
1. Define the concept of statistical process control SPC?
2. What is SPC key element?
3. Solving the following problem (Using x -charts and R
–charts)?
a. Using this data to solve the problem by using X bar chart and
R chart?
b. What is the difference between X bar chart and R chart?
c. Draw the control chart for both X bar chart and R chart?
d. Explain the result?...
 A paper mill uses a control chart to Data on Imperfections in Rolls of Paper monitor the imperfection in finished Total Total Ils of paper. Production output is umber Number of Number Number of of Rolls Imper- Day Produced fections Day Produced fections inspected for twenty days, and the resulting data are shown here. Use these data to set up a control chart for 218 4 12 18 14 nonconformities per roll of paper. Does the process appear to be...
Most questions answered within 3 hours.
-
Where is the error in this code sequence?
String s1 = "Hello";
String s2 = "ello";...
asked 10 months ago -
Financial data for Joel de Paris, Inc., for last year
follow:
Joel de Paris, Inc.
Balance...
asked 10 months ago -
Consider this reaction:
Al2(SO4)3 (aq)+ BaCl3
(aq) Al2Cl6 (aq)- +
3BaSO4(s) . What is the...
asked 10 months ago -
Suppose that Savneet is considering increasing her
recent random sample from 20 car rentals to 40...
asked 10 months ago -
Trucks arrive at an unloading terminal at an average rate of 120
per hour.
Trucks arrive...
asked 10 months ago -
Why are methanol and ethanol completely soluble in water while
octanol is not very little soluble....
asked 10 months ago -
A facilities manager at a university reads in a research report
that the mean amount of...
asked 10 months ago -
When the CuSO4 is rehydrated by adding water to the anhydrous
compound, is this an endothermic...
asked 10 months ago -
A ray of sunlight is passing from diamond into crown glass; the
angle of incidence is...
asked 10 months ago -
A block of mass 0.249 kg is placed on top of a light, vertical
spring of...
asked 10 months ago -
how do the kidneys compensate in the presences of acidosis
a) trigger hyperventilate
b) reserve acid...
asked 10 months ago -
Question 501 pts
The rental rate of capital to the firm increases. Which of the
following...
asked 10 months ago