
Homework Answers
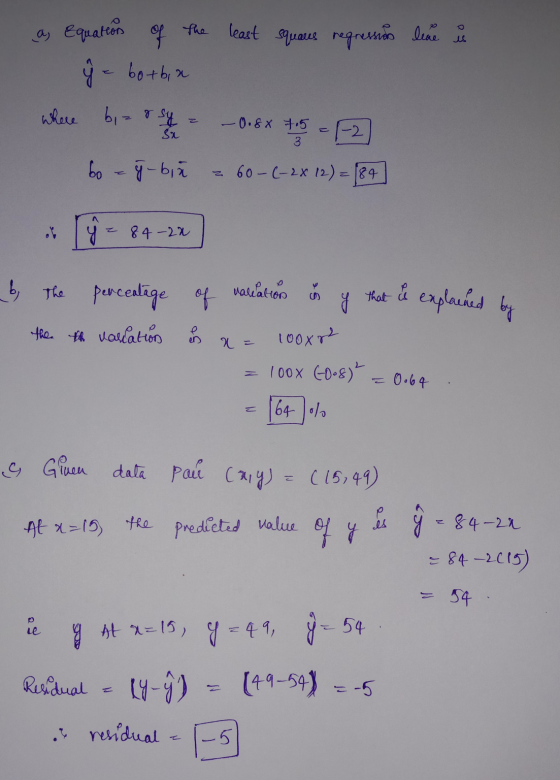
Equation of regression line is y^=b0 + b1x.
Where b1=r.sy/sx
b0 = ybar-b1.xbar
Residual is the difference between actual y value and the predicted y value =y-y^.
Add Answer to:
could someone please help me solve this and show the steps in
the calculator as well??...
alpha .05 //// could someone please help me solve this and show the steps in the...
 alpha .05 //// could someone please help me solve this and
show the steps in the calculator?? thank you!!
8 3. Consider the following dataset: X 1 3 6 Y 4 7 10 12 15 14 3 (a) Test the claim that a nonzero correlation exists between x and y. (b) Graph the data and the regression line. Does there appear to be an influential point? An outlier?
alpha .05 //// could someone please help me solve this and
show the steps in the calculator?? thank you!!
8 3. Consider the following dataset: X 1 3 6 Y 4 7 10 12 15 14 3 (a) Test the claim that a nonzero correlation exists between x and y. (b) Graph the data and the regression line. Does there appear to be an influential point? An outlier?
could someone please help me solve this and show the steps on the calculator?? thank you!!...
 could someone please help me solve this and show the steps on
the calculator?? thank you!!
8. The contingency (two-way) table below shows the results of a random sample of 2197 adults classified by their favorite way to eat ice cream and gender. Gender Cone Sundae Sandwich Other Total Male 504 287 182 43 53 1069 Female 474 401 158 45 50 1128 Total 978 688 340 88 103 2197 Cup At alpha 01, can you conclude that one's favorite...
could someone please help me solve this and show the steps on
the calculator?? thank you!!
8. The contingency (two-way) table below shows the results of a random sample of 2197 adults classified by their favorite way to eat ice cream and gender. Gender Cone Sundae Sandwich Other Total Male 504 287 182 43 53 1069 Female 474 401 158 45 50 1128 Total 978 688 340 88 103 2197 Cup At alpha 01, can you conclude that one's favorite...
Could someone help me solve this question and show all work 7. Let X = (x1,.....
 Could someone help me solve this question and show all work
7. Let X = (x1,.. . , x.) be a data set. Let sz-SD(X). Let Y = aX-b. (a) Show that Sy-SD(Y) = lal&z. (b) Show that Median(Y) = a . Median(X) + b. (c) Can you write the relation between Q1(y) and Q1 (X). What happens if a < 0.
Could someone help me solve this question and show all work
7. Let X = (x1,.. . , x.) be a data set. Let sz-SD(X). Let Y = aX-b. (a) Show that Sy-SD(Y) = lal&z. (b) Show that Median(Y) = a . Median(X) + b. (c) Can you write the relation between Q1(y) and Q1 (X). What happens if a < 0.
please show the steps and the code to solve this in R, thank you 11. (10 marks) (using dataset: "hpricel", in R:...
 please show the steps and the
code to solve this in R, thank you
11. (10 marks) (using dataset: "hpricel", in R: data(hprice1, package-wooldridge')) Use the data to 5 estimate the model where price is the house price measured in thousands of dollars iWrite out the results in equation form. iiWhat is the estimated increase in price for a house with one more bedroom, holding square footage and lot size constant? iii What is the estimated increase in price for...
please show the steps and the
code to solve this in R, thank you
11. (10 marks) (using dataset: "hpricel", in R: data(hprice1, package-wooldridge')) Use the data to 5 estimate the model where price is the house price measured in thousands of dollars iWrite out the results in equation form. iiWhat is the estimated increase in price for a house with one more bedroom, holding square footage and lot size constant? iii What is the estimated increase in price for...
Can someone please help me solve these!! Show steps and answer, thank you! I have figured...
 Can someone please help me solve these!! Show steps and
answer, thank you!
I
have figured out what the base concentration is for the second
picture. I only need help with finding the volume in the first
picture. What I have posted is all that was given.
ka
is not given, I beleive it has to be found.
A solution of household bleach contains 5.25% sodium hypochlorite, NaOCI, by mass. Assuming that the density of bleach is the same as...
Can someone please help me solve these!! Show steps and
answer, thank you!
I
have figured out what the base concentration is for the second
picture. I only need help with finding the volume in the first
picture. What I have posted is all that was given.
ka
is not given, I beleive it has to be found.
A solution of household bleach contains 5.25% sodium hypochlorite, NaOCI, by mass. Assuming that the density of bleach is the same as...
I need help with how to solve these simultaneous equations. Could someone please show me the...
 I need help with how to solve these simultaneous equations.
Could someone please show me the steps to get to the answer.
Sum of forces in the x direction is zero i.e. FCD COs 33.69"-FAD COS 33.69"-FDE COS 33.690-0 54.08xcos 33.69 - FAD coS 33.69 F cos 33.69... .(5) Sum of forces in the y direction is zero i.e FRD +Fcn sin 33.69" + FAD sin 33.69 - FDE sin 33.690 -20-54.08x sin 33.69" + FD sin 33.69-Fg sin 33.690...
I need help with how to solve these simultaneous equations.
Could someone please show me the steps to get to the answer.
Sum of forces in the x direction is zero i.e. FCD COs 33.69"-FAD COS 33.69"-FDE COS 33.690-0 54.08xcos 33.69 - FAD coS 33.69 F cos 33.69... .(5) Sum of forces in the y direction is zero i.e FRD +Fcn sin 33.69" + FAD sin 33.69 - FDE sin 33.690 -20-54.08x sin 33.69" + FD sin 33.69-Fg sin 33.690...
Can someone please help me solve these problems without skipping steps I need to understand the...
 Can someone please help me solve these problems without
skipping steps I need to understand the process. Thank
you
If V xy 2xy2 + yz, evaluate V dr between A (0, 0, 0) and B (2, 1, -3) along the curve with parametric equations x 2t, y t, z 3t3 If F-ry® i + yz2 j + zx2 k, evaluate | F-dr along the curve x 3u2, y u, z 2u between A (3,-1, 2) and B (3, 1,2) Evaluate...
Can someone please help me solve these problems without
skipping steps I need to understand the process. Thank
you
If V xy 2xy2 + yz, evaluate V dr between A (0, 0, 0) and B (2, 1, -3) along the curve with parametric equations x 2t, y t, z 3t3 If F-ry® i + yz2 j + zx2 k, evaluate | F-dr along the curve x 3u2, y u, z 2u between A (3,-1, 2) and B (3, 1,2) Evaluate...
Could someone please help me figure out how to solve these problems for Fundamentals of Electromagnetics? I've seen...
 Could someone please help me figure out how to solve these
problems for Fundamentals of Electromagnetics? I've seen posts for
this questions that simply post the converted base vectors and
answers, but I'm confused how to convert them in the first place.
For example, in part b, I see answers that immediately convert
ay into
but I can't figure out how that was determined in the first place.
Can someone please help me with those steps in particular? Thank
you...
Could someone please help me figure out how to solve these
problems for Fundamentals of Electromagnetics? I've seen posts for
this questions that simply post the converted base vectors and
answers, but I'm confused how to convert them in the first place.
For example, in part b, I see answers that immediately convert
ay into
but I can't figure out how that was determined in the first place.
Can someone please help me with those steps in particular? Thank
you...
could someone help me understand these problems, the proper steps to solve them please. 1) A...
 could someone help me understand these problems, the
proper steps to solve them please.
1) A person walks first at a constant speed of 1.35 m/s along a straight line from point to point and then back along the line from B to at a constant speed of 0.75 m/s. It takes the person 100s to walk from point @to point . a) What is her average speed over the entire trip? (10 points) b) What is her average velocity...
could someone help me understand these problems, the
proper steps to solve them please.
1) A person walks first at a constant speed of 1.35 m/s along a straight line from point to point and then back along the line from B to at a constant speed of 0.75 m/s. It takes the person 100s to walk from point @to point . a) What is her average speed over the entire trip? (10 points) b) What is her average velocity...
Please I want someone help me to solve this question a,b,c,d,e I’m not sure about my...
 Please I want someone help me to solve this question
a,b,c,d,e
I’m not sure about my solution
This is the data
# Set directory to data folder
setwd("C:data")
# getwd()
# Read data from csv file
data <- read.csv("SweetPotatoFirmness.csv",header=TRUE,
sep=",")
head(data)
str(data)
# scatterplot of independent and dependent variables
plot(data$pectin,data$firmness,xlab="Pectin,
%",ylab="Firmness")
par(mfrow = c(2, 2)) # Split the plotting panel into a 2 x 2
grid
model <- lm(firmness ~ pectin , data=data)
summary(model)
plot(model)
par(mfrow=c(1,1))
# Residual Plot
data$residuals...
Please I want someone help me to solve this question
a,b,c,d,e
I’m not sure about my solution
This is the data
# Set directory to data folder
setwd("C:data")
# getwd()
# Read data from csv file
data <- read.csv("SweetPotatoFirmness.csv",header=TRUE,
sep=",")
head(data)
str(data)
# scatterplot of independent and dependent variables
plot(data$pectin,data$firmness,xlab="Pectin,
%",ylab="Firmness")
par(mfrow = c(2, 2)) # Split the plotting panel into a 2 x 2
grid
model <- lm(firmness ~ pectin , data=data)
summary(model)
plot(model)
par(mfrow=c(1,1))
# Residual Plot
data$residuals...
 alpha .05 //// could someone please help me solve this and
show the steps in the calculator?? thank you!!
8 3. Consider the following dataset: X 1 3 6 Y 4 7 10 12 15 14 3 (a) Test the claim that a nonzero correlation exists between x and y. (b) Graph the data and the regression line. Does there appear to be an influential point? An outlier?
alpha .05 //// could someone please help me solve this and
show the steps in the calculator?? thank you!!
8 3. Consider the following dataset: X 1 3 6 Y 4 7 10 12 15 14 3 (a) Test the claim that a nonzero correlation exists between x and y. (b) Graph the data and the regression line. Does there appear to be an influential point? An outlier?
 could someone please help me solve this and show the steps on
the calculator?? thank you!!
8. The contingency (two-way) table below shows the results of a random sample of 2197 adults classified by their favorite way to eat ice cream and gender. Gender Cone Sundae Sandwich Other Total Male 504 287 182 43 53 1069 Female 474 401 158 45 50 1128 Total 978 688 340 88 103 2197 Cup At alpha 01, can you conclude that one's favorite...
could someone please help me solve this and show the steps on
the calculator?? thank you!!
8. The contingency (two-way) table below shows the results of a random sample of 2197 adults classified by their favorite way to eat ice cream and gender. Gender Cone Sundae Sandwich Other Total Male 504 287 182 43 53 1069 Female 474 401 158 45 50 1128 Total 978 688 340 88 103 2197 Cup At alpha 01, can you conclude that one's favorite...
 Could someone help me solve this question and show all work
7. Let X = (x1,.. . , x.) be a data set. Let sz-SD(X). Let Y = aX-b. (a) Show that Sy-SD(Y) = lal&z. (b) Show that Median(Y) = a . Median(X) + b. (c) Can you write the relation between Q1(y) and Q1 (X). What happens if a < 0.
Could someone help me solve this question and show all work
7. Let X = (x1,.. . , x.) be a data set. Let sz-SD(X). Let Y = aX-b. (a) Show that Sy-SD(Y) = lal&z. (b) Show that Median(Y) = a . Median(X) + b. (c) Can you write the relation between Q1(y) and Q1 (X). What happens if a < 0.
 please show the steps and the
code to solve this in R, thank you
11. (10 marks) (using dataset: "hpricel", in R: data(hprice1, package-wooldridge')) Use the data to 5 estimate the model where price is the house price measured in thousands of dollars iWrite out the results in equation form. iiWhat is the estimated increase in price for a house with one more bedroom, holding square footage and lot size constant? iii What is the estimated increase in price for...
please show the steps and the
code to solve this in R, thank you
11. (10 marks) (using dataset: "hpricel", in R: data(hprice1, package-wooldridge')) Use the data to 5 estimate the model where price is the house price measured in thousands of dollars iWrite out the results in equation form. iiWhat is the estimated increase in price for a house with one more bedroom, holding square footage and lot size constant? iii What is the estimated increase in price for...
 Can someone please help me solve these!! Show steps and
answer, thank you!
I
have figured out what the base concentration is for the second
picture. I only need help with finding the volume in the first
picture. What I have posted is all that was given.
ka
is not given, I beleive it has to be found.
A solution of household bleach contains 5.25% sodium hypochlorite, NaOCI, by mass. Assuming that the density of bleach is the same as...
Can someone please help me solve these!! Show steps and
answer, thank you!
I
have figured out what the base concentration is for the second
picture. I only need help with finding the volume in the first
picture. What I have posted is all that was given.
ka
is not given, I beleive it has to be found.
A solution of household bleach contains 5.25% sodium hypochlorite, NaOCI, by mass. Assuming that the density of bleach is the same as...
 I need help with how to solve these simultaneous equations.
Could someone please show me the steps to get to the answer.
Sum of forces in the x direction is zero i.e. FCD COs 33.69"-FAD COS 33.69"-FDE COS 33.690-0 54.08xcos 33.69 - FAD coS 33.69 F cos 33.69... .(5) Sum of forces in the y direction is zero i.e FRD +Fcn sin 33.69" + FAD sin 33.69 - FDE sin 33.690 -20-54.08x sin 33.69" + FD sin 33.69-Fg sin 33.690...
I need help with how to solve these simultaneous equations.
Could someone please show me the steps to get to the answer.
Sum of forces in the x direction is zero i.e. FCD COs 33.69"-FAD COS 33.69"-FDE COS 33.690-0 54.08xcos 33.69 - FAD coS 33.69 F cos 33.69... .(5) Sum of forces in the y direction is zero i.e FRD +Fcn sin 33.69" + FAD sin 33.69 - FDE sin 33.690 -20-54.08x sin 33.69" + FD sin 33.69-Fg sin 33.690...
 Can someone please help me solve these problems without
skipping steps I need to understand the process. Thank
you
If V xy 2xy2 + yz, evaluate V dr between A (0, 0, 0) and B (2, 1, -3) along the curve with parametric equations x 2t, y t, z 3t3 If F-ry® i + yz2 j + zx2 k, evaluate | F-dr along the curve x 3u2, y u, z 2u between A (3,-1, 2) and B (3, 1,2) Evaluate...
Can someone please help me solve these problems without
skipping steps I need to understand the process. Thank
you
If V xy 2xy2 + yz, evaluate V dr between A (0, 0, 0) and B (2, 1, -3) along the curve with parametric equations x 2t, y t, z 3t3 If F-ry® i + yz2 j + zx2 k, evaluate | F-dr along the curve x 3u2, y u, z 2u between A (3,-1, 2) and B (3, 1,2) Evaluate...
 Could someone please help me figure out how to solve these
problems for Fundamentals of Electromagnetics? I've seen posts for
this questions that simply post the converted base vectors and
answers, but I'm confused how to convert them in the first place.
For example, in part b, I see answers that immediately convert
ay into
but I can't figure out how that was determined in the first place.
Can someone please help me with those steps in particular? Thank
you...
Could someone please help me figure out how to solve these
problems for Fundamentals of Electromagnetics? I've seen posts for
this questions that simply post the converted base vectors and
answers, but I'm confused how to convert them in the first place.
For example, in part b, I see answers that immediately convert
ay into
but I can't figure out how that was determined in the first place.
Can someone please help me with those steps in particular? Thank
you...
 could someone help me understand these problems, the
proper steps to solve them please.
1) A person walks first at a constant speed of 1.35 m/s along a straight line from point to point and then back along the line from B to at a constant speed of 0.75 m/s. It takes the person 100s to walk from point @to point . a) What is her average speed over the entire trip? (10 points) b) What is her average velocity...
could someone help me understand these problems, the
proper steps to solve them please.
1) A person walks first at a constant speed of 1.35 m/s along a straight line from point to point and then back along the line from B to at a constant speed of 0.75 m/s. It takes the person 100s to walk from point @to point . a) What is her average speed over the entire trip? (10 points) b) What is her average velocity...
 Please I want someone help me to solve this question
a,b,c,d,e
I’m not sure about my solution
This is the data
# Set directory to data folder
setwd("C:data")
# getwd()
# Read data from csv file
data <- read.csv("SweetPotatoFirmness.csv",header=TRUE,
sep=",")
head(data)
str(data)
# scatterplot of independent and dependent variables
plot(data$pectin,data$firmness,xlab="Pectin,
%",ylab="Firmness")
par(mfrow = c(2, 2)) # Split the plotting panel into a 2 x 2
grid
model <- lm(firmness ~ pectin , data=data)
summary(model)
plot(model)
par(mfrow=c(1,1))
# Residual Plot
data$residuals...
Please I want someone help me to solve this question
a,b,c,d,e
I’m not sure about my solution
This is the data
# Set directory to data folder
setwd("C:data")
# getwd()
# Read data from csv file
data <- read.csv("SweetPotatoFirmness.csv",header=TRUE,
sep=",")
head(data)
str(data)
# scatterplot of independent and dependent variables
plot(data$pectin,data$firmness,xlab="Pectin,
%",ylab="Firmness")
par(mfrow = c(2, 2)) # Split the plotting panel into a 2 x 2
grid
model <- lm(firmness ~ pectin , data=data)
summary(model)
plot(model)
par(mfrow=c(1,1))
# Residual Plot
data$residuals...
Most questions answered within 3 hours.
-
Where is the error in this code sequence?
String s1 = "Hello";
String s2 = "ello";...
asked 10 months ago -
Financial data for Joel de Paris, Inc., for last year
follow:
Joel de Paris, Inc.
Balance...
asked 10 months ago -
Consider this reaction:
Al2(SO4)3 (aq)+ BaCl3
(aq) Al2Cl6 (aq)- +
3BaSO4(s) . What is the...
asked 10 months ago -
Suppose that Savneet is considering increasing her
recent random sample from 20 car rentals to 40...
asked 10 months ago -
Trucks arrive at an unloading terminal at an average rate of 120
per hour.
Trucks arrive...
asked 10 months ago -
Why are methanol and ethanol completely soluble in water while
octanol is not very little soluble....
asked 10 months ago -
A facilities manager at a university reads in a research report
that the mean amount of...
asked 10 months ago -
When the CuSO4 is rehydrated by adding water to the anhydrous
compound, is this an endothermic...
asked 10 months ago -
A ray of sunlight is passing from diamond into crown glass; the
angle of incidence is...
asked 10 months ago -
A block of mass 0.249 kg is placed on top of a light, vertical
spring of...
asked 10 months ago -
how do the kidneys compensate in the presences of acidosis
a) trigger hyperventilate
b) reserve acid...
asked 10 months ago -
Question 501 pts
The rental rate of capital to the firm increases. Which of the
following...
asked 10 months ago