
Homework Answers
Answer to the above Question is given below:

Add Answer to:
08). Starbucks Corporation reported the following geographical segment revenues for a recent ter 5 Accounting Systems...
arship Corporation reported the following geographical segment revenues for a recent and a prior fiscal year:...
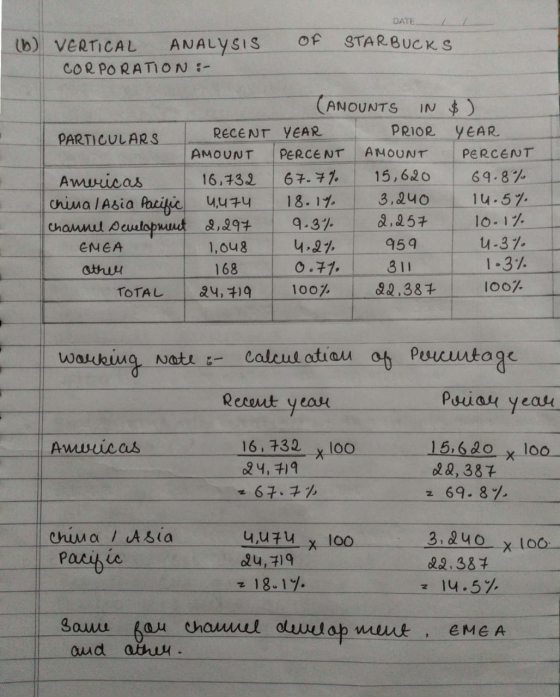
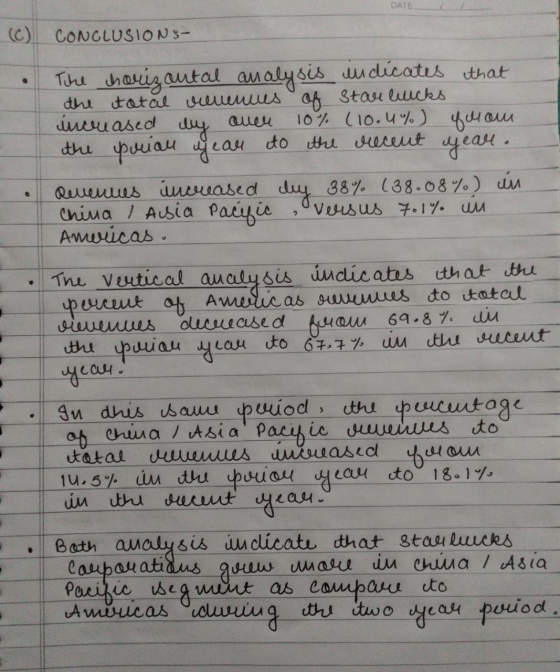
 arship Corporation reported the following geographical segment revenues for a recent and a prior fiscal year: Recent Year (in millions, rounded) Prior Year (in millions, rounded) Americas $6,529 $5,514 EMEA 1,217 1,295 China/Asia Pacific 2,396 1,130 Channel Development** 1,731 1,546 Other 1,348 1,158 Total $13,221 $10,643 *Europe, Middle East, and Africa **Sells packaged coffee and teas globally a. Prepare a horizontal analysis of the segment data using the prior year as the base year. Round all percents to one decimal...
Segment Revenue Horizontal and Vertical Analyses The comparative segment revenues for Clara Corporation, a global quick-serve...
 Segment Revenue Horizontal and Vertical Analyses The comparative segment revenues for Clara Corporation, a global quick-serve restaurant company, are as follows: Recent Year (in millions) China $ 64,976 Prior Year (in millions) $ 62,000 71,000 31,000 KFC 63,545 Pizza Hut 33,325 31,291 Taco Bell 29,000 India 115 Total $ 193,252 $ 193,141 a. Provide a horizontal analysis of the regional segment revenues using prior year as the base year. Round all percentages to one decimal place. Enter all amounts in...
Segment Revenue Horizontal and Vertical Analyses The comparative segment revenues for Clara Corporation, a global quick-serve...
 Segment Revenue Horizontal and Vertical Analyses The comparative segment revenues for Clara Corporation, a global quick-serve restaurant company, are as follows: Recent Year Prior Year (in millions) (in millions) $ 64,976 $ 62,000 China 71,000 63,545 KFC 33,325 31,000 Pizza Hut 29,000 31,291 Taco Bell 141 115 India $ 193,252 $ 193,141 Total a. Provide a horizontal analysis of the regional segment revenues using prior year as the base year. Round all percentages to one decimal place. Enter all amounts...
Payton Company has the following segment revenues for the two most recent fiscal years. Current Year...
Payton Company has the following segment revenues for the two most recent fiscal years. Current Year (in millions) Prior Year (in millions) China $775.00 $650.00 Canada 325.50 245.50 Other countries 215.50 168.50 Total revenues $1,316.00 $1,064.00 Required: Prepare a vertical analysis of the segment data. Round your percentage value to one decimal place. Prepare a vertical analysis of the segment data. Round your percentage value to one decimal place. 1 Current Year (in millions) Percent Prior Year (in millions) Percent...
Payton Company has the following segment revenues for the two most recent fiscal years. Segment Current...
Payton Company has the following segment revenues for the two most recent fiscal years. Segment Current Year (in millions) Prior Year (in millions) China $710 $640 Canada 338 245 Other countries 214 170 Total revenues $1,262 $1,055 Prepare a vertical analysis of the segment data. Calculate the percentage to four decimal places, then round your answer to one decimal place. For percentages, do not enter the percent sign.
TUTVU Chitralor Payton Company has the following segment revenues for the two most recent years. Segment...
 TUTVU Chitralor Payton Company has the following segment revenues for the two most recent years. Segment United States Canada Other countries Total reverw Current Year Prior Year in millions) (in millions) $815 5600 322 347 216 $1.254 $1.110 163 Prepare a horontal analysis of the segment data. Calculate the percentage to four decimal places, the round your answer to one decimal place. Do not enter the percent sign. For amount or percentage decreases, enter a minus sign Payton Company Horizontal...
Question 10 Not yet graded/2.5 pts Payton Company has the following segment revenues for the two most recent years....
 Question 10 Not yet graded/2.5 pts Payton Company has the following segment revenues for the two most recent years. Segment Current Year (in millions) Prior Year (in millions) United States $ 825.00 $ 600.00 Canada 325.50 345.50 Other countries 215.50 168.50 Total revenues $1.366.00 $1,114.00 Prepare a horizontal analysis of the segment data. Round to one decimal place. Upload a file with your answer.
Analyze The Walt Disney Company by segment The Walt Disney Company (DIS) is a leading worldwide...
 Analyze The Walt Disney Company by segment The Walt Disney Company (DIS) is a leading worldwide entertainment company. Disney operates four business segments. These segments and some of their larger businesses are: • Media Networks: ABC Network, ESPN, Disney Channel, and A&E • Parks and Resorts: Walt Disney World Resort, Disneyland, and International Disney Resorts • Studio Entertainment: Walt Disney Pictures, Pixar, Marvel, and Lucasfilm • Consumer Products and Interactive Media: Licensing of Disney characters, publishing, and retail stores Recent...
Segment Contribution Margin Analysis The operating revenues of the three largest business segments for Time Warner,...
 Segment Contribution Margin Analysis The operating revenues of the three largest business segments for Time Warner, Inc., for a recent year follow. Each segment includes a number of businesses, examples of which are indicated in parentheses. Time Warner, Inc. Segment Revenues (in millions) Turner (cable networks and digital media) $64,200 87,100 Home Box Office (pay television) Warner Bros. (films, television, and videos) 76,600 Assume that the variable costs as a percent of sales for each segment are as follows: 34%...
Segment Contribution Margin Analysis The operating revenues of the three largest business segments for Time Warner,...
 Segment Contribution Margin Analysis The operating revenues of the three largest business segments for Time Warner, Inc., for a recent year follow. Each segment includes a number businesses, examples of which are indicated in parentheses. Time Warner, Inc. Segment Revenues (in millions) Turner (cable networks and digital media) $15,000 Home Box Office (pay television) 20,000 Warner Bros. (films, television, and videos) 75,400 Assume that the variable costs as a percent of sales for each segment are as follows: Turner 42%...
 arship Corporation reported the following geographical segment revenues for a recent and a prior fiscal year: Recent Year (in millions, rounded) Prior Year (in millions, rounded) Americas $6,529 $5,514 EMEA 1,217 1,295 China/Asia Pacific 2,396 1,130 Channel Development** 1,731 1,546 Other 1,348 1,158 Total $13,221 $10,643 *Europe, Middle East, and Africa **Sells packaged coffee and teas globally a. Prepare a horizontal analysis of the segment data using the prior year as the base year. Round all percents to one decimal...
 Segment Revenue Horizontal and Vertical Analyses The comparative segment revenues for Clara Corporation, a global quick-serve restaurant company, are as follows: Recent Year (in millions) China $ 64,976 Prior Year (in millions) $ 62,000 71,000 31,000 KFC 63,545 Pizza Hut 33,325 31,291 Taco Bell 29,000 India 115 Total $ 193,252 $ 193,141 a. Provide a horizontal analysis of the regional segment revenues using prior year as the base year. Round all percentages to one decimal place. Enter all amounts in...
 Segment Revenue Horizontal and Vertical Analyses The comparative segment revenues for Clara Corporation, a global quick-serve restaurant company, are as follows: Recent Year Prior Year (in millions) (in millions) $ 64,976 $ 62,000 China 71,000 63,545 KFC 33,325 31,000 Pizza Hut 29,000 31,291 Taco Bell 141 115 India $ 193,252 $ 193,141 Total a. Provide a horizontal analysis of the regional segment revenues using prior year as the base year. Round all percentages to one decimal place. Enter all amounts...
 TUTVU Chitralor Payton Company has the following segment revenues for the two most recent years. Segment United States Canada Other countries Total reverw Current Year Prior Year in millions) (in millions) $815 5600 322 347 216 $1.254 $1.110 163 Prepare a horontal analysis of the segment data. Calculate the percentage to four decimal places, the round your answer to one decimal place. Do not enter the percent sign. For amount or percentage decreases, enter a minus sign Payton Company Horizontal...
 Question 10 Not yet graded/2.5 pts Payton Company has the following segment revenues for the two most recent years. Segment Current Year (in millions) Prior Year (in millions) United States $ 825.00 $ 600.00 Canada 325.50 345.50 Other countries 215.50 168.50 Total revenues $1.366.00 $1,114.00 Prepare a horizontal analysis of the segment data. Round to one decimal place. Upload a file with your answer.
 Analyze The Walt Disney Company by segment The Walt Disney Company (DIS) is a leading worldwide entertainment company. Disney operates four business segments. These segments and some of their larger businesses are: • Media Networks: ABC Network, ESPN, Disney Channel, and A&E • Parks and Resorts: Walt Disney World Resort, Disneyland, and International Disney Resorts • Studio Entertainment: Walt Disney Pictures, Pixar, Marvel, and Lucasfilm • Consumer Products and Interactive Media: Licensing of Disney characters, publishing, and retail stores Recent...
 Segment Contribution Margin Analysis The operating revenues of the three largest business segments for Time Warner, Inc., for a recent year follow. Each segment includes a number of businesses, examples of which are indicated in parentheses. Time Warner, Inc. Segment Revenues (in millions) Turner (cable networks and digital media) $64,200 87,100 Home Box Office (pay television) Warner Bros. (films, television, and videos) 76,600 Assume that the variable costs as a percent of sales for each segment are as follows: 34%...
 Segment Contribution Margin Analysis The operating revenues of the three largest business segments for Time Warner, Inc., for a recent year follow. Each segment includes a number businesses, examples of which are indicated in parentheses. Time Warner, Inc. Segment Revenues (in millions) Turner (cable networks and digital media) $15,000 Home Box Office (pay television) 20,000 Warner Bros. (films, television, and videos) 75,400 Assume that the variable costs as a percent of sales for each segment are as follows: Turner 42%...
Most questions answered within 3 hours.
-
Where is the error in this code sequence?
String s1 = "Hello";
String s2 = "ello";...
asked 10 months ago -
Financial data for Joel de Paris, Inc., for last year
follow:
Joel de Paris, Inc.
Balance...
asked 10 months ago -
Consider this reaction:
Al2(SO4)3 (aq)+ BaCl3
(aq) Al2Cl6 (aq)- +
3BaSO4(s) . What is the...
asked 10 months ago -
Suppose that Savneet is considering increasing her
recent random sample from 20 car rentals to 40...
asked 10 months ago -
Trucks arrive at an unloading terminal at an average rate of 120
per hour.
Trucks arrive...
asked 10 months ago -
Why are methanol and ethanol completely soluble in water while
octanol is not very little soluble....
asked 10 months ago -
A facilities manager at a university reads in a research report
that the mean amount of...
asked 10 months ago -
When the CuSO4 is rehydrated by adding water to the anhydrous
compound, is this an endothermic...
asked 10 months ago -
A ray of sunlight is passing from diamond into crown glass; the
angle of incidence is...
asked 10 months ago -
A block of mass 0.249 kg is placed on top of a light, vertical
spring of...
asked 10 months ago -
how do the kidneys compensate in the presences of acidosis
a) trigger hyperventilate
b) reserve acid...
asked 10 months ago -
Question 501 pts
The rental rate of capital to the firm increases. Which of the
following...
asked 10 months ago