Presented below are the comparative balance sheets of Joe’s Garage, Inc., at December 31, 2020, and...
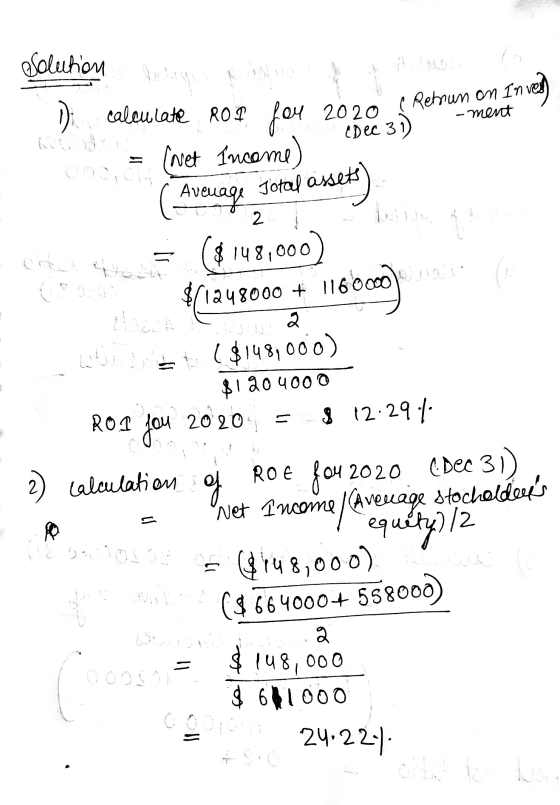
Presented below are the comparative balance sheets of Joe’s Garage, Inc., at December 31, 2020, and 2019. Sales for the year ended December 31, 2020, totaled $1,780,000.
| JOE’S GARAGE, INC. | |||||||
| Balance Sheets | |||||||
| December 31, 2020, and 2019 | |||||||
| 2020 | 2019 | ||||||
| Assets | |||||||
| Cash | $ | 90,000 | $ | 98,000 | |||
| Accounts receivable | 268,000 | 212,000 | |||||
| Merchandise inventory | 402,000 | 394,000 | |||||
| Total current assets | $ | 760,000 | $ | 704,000 | |||
| Land | 132,000 | 120,000 | |||||
| Plant and equipment | 728,000 | 650,000 | |||||
| Less: Accumulated depreciation | (372,000 | ) | (314,000 | ) | |||
| Total assets | $ | 1,248,000 | $ | 1,160,000 | |||
| Liabilities | |||||||
| Short-term debt | $ | 98,000 | $ | 86,000 | |||
| Accounts payable | 184,000 | 168,000 | |||||
| Other accrued liabilities | 128,000 | 134,000 | |||||
| Total current liabilities | $ | 410,000 | $ | 388,000 | |||
| Long-term debt | 174,000 | 214,000 | |||||
| Total liabilities | $ | 584,000 | $ | 602,000 | |||
| Stockholders’ Equity | |||||||
| Common stock, no par, 100,000 shares authorized, 35,000 and 28,000 shares issued, respectively | $ | 204,000 | $ | 156,000 | |||
| Retained earnings: | |||||||
| Beginning balance | 402,000 | 336,000 | |||||
| Net income for the year | 148,000 | 134,000 | |||||
| Dividends for the year | (90,000 | ) | (68,000 | ) | |||
| Ending balance | $ | 460,000 | $ | 402,000 | |||
| Total stockholders’ equity | $ | 664,000 | $ | 558,000 | |||
| Total liabilities and stockholders’ equity | $ | 1,248,000 | $ | 1,160,000 | |||
Required:
A) Calculate ROI for 2020.
B) Calculate ROE for 2020.
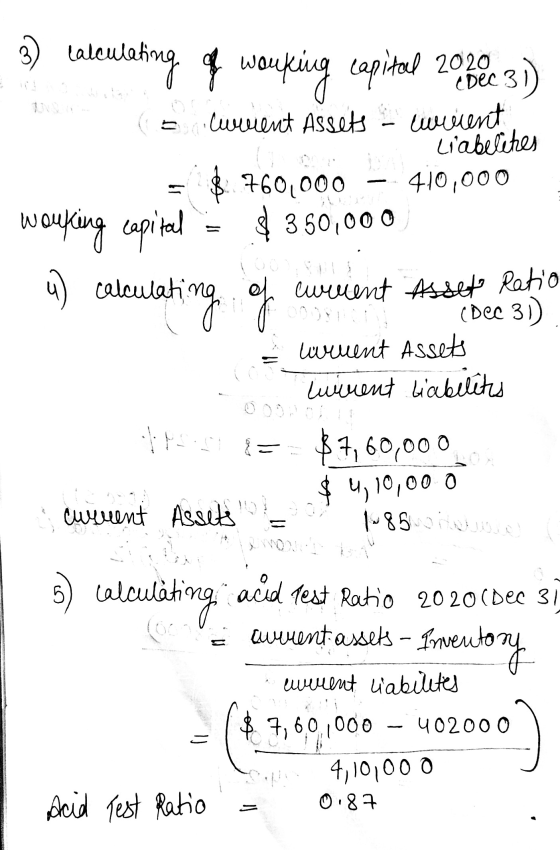
C) Calculate working capital at December 31, 2020.
D) Calculate the current ratio at December 31, 2020.
E) Calculate the acid-test ratio at December 31, 2020.
Homework Answers
Add Answer to:
Presented below are the comparative balance sheets of Joe’s
Garage, Inc., at December 31, 2020, and...
Presented here are the comparative balance sheets of Hames Inc. at December 31, 2020 and 2019....
Presented here are the comparative balance sheets of Hames Inc. at December 31, 2020 and 2019. Sales for the year ended December 31, 2020, totaled $540,000. HAMES INC. Balance Sheets December 31, 2020 and 2019 2020 2019 Assets Cash $ 24,000 $ 21,000 Accounts receivable 78,000 72,000 Merchandise inventory 103,000 99,000 Total current assets $ 205,000 $ 192,000 Land 50,000 40,000 Plant and equipment 125,000 110,000 Less: Accumulated depreciation (65,000 ) (60,000 ) Total assets $ 315,000 $ 282,000 Liabilities...
Chech Presented here are the comparative balance sheets of Hames Inc. at December 31, 2020 and...
 Chech Presented here are the comparative balance sheets of Hames Inc. at December 31, 2020 and 2019. Sales for the year ended December 31, 2020, totaled $670,000. HAMES INC. Balance Sheets December 31, 2020 and 2019 2020 2019 $ 25,000 78,000 103,000 $ 206,000 50,000 125,000 (65,000) $ 316,000 $ 20,000 72,000 99,000 $191,000 40,000 110,000 (60,000) $ 281,000 Assets Cash Accounts receivable Merchandise inventory Total current assets Land Plant and equipment Less: Accumulated depreciation Total assets Liabilities Short-term debt...
Presented here are the comparative balance sheets of Hames Inc. at December 31, 2020 and 2019....
Presented here are the comparative balance sheets of Hames Inc. at December 31, 2020 and 2019. Sales for the year ended December 31, 2020, totaled $690,000. HAMES INC. Balance Sheets December 31, 2020 and 2019 2020 2019 Assets Cash $ 20,000 $ 19,000 Accounts receivable 78,000 72,000 Merchandise inventory 103,000 99,000 Total current assets $ 201,000 $ 190,000 Land 50,000 40,000 Plant and equipment 125,000 110,000 Less: Accumulated depreciation (65,000 ) (60,000 ) Total assets $ 311,000 $ 280,000 Liabilities...
Presented here are the comparative balance sheets of Hames Inc. at December 31, 2020 and 2019....
 Presented here are the comparative balance sheets of Hames Inc. at December 31, 2020 and 2019. Sales for the year ended December 31, 2020, totaled $650,000. HAMES INC. Balance Sheets December 31, 2020 and 2019 2020 2019 $ 19,000 78,000 103,000 $ 200,000 50,000 125,000 (65,000) $ 310,000 $ 20,000 72,000 99,000 $191,000 40,000 110,000 (60,000) $ 281,000 Assets Cash Accounts receivable Merchandise inventory Total current assets Land Plant and equipment Less: Accumulated depreciation Total assets Liabilities Short-term debt Accounts...
Presented here are the comparative balance sheets of Hames Inc. at December 31, 2020 and 2019....
Presented here are the comparative balance sheets of Hames Inc. at December 31, 2020 and 2019. Sales for the year ended December 31, 2020, totaled $630,000. HAMES INC. Balance Sheets December 31, 2020 and 2019 2020 2019 Assets Cash $ 20,000 $ 21,000 Accounts receivable 78,000 72,000 Merchandise inventory 103,000 99,000 Total current assets $ 201,000 $ 192,000 Land 50,000 40,000 Plant and equipment 125,000 110,000 Less: Accumulated depreciation (65,000 ) (60,000 ) Total assets $ 311,000 $ 282,000 Liabilities...
Presented here are the comparative balance sheets of Hames Inc. at December 31, 2020 and 2019....
 Presented here are the comparative balance sheets of Hames Inc. at December 31, 2020 and 2019. Sales for the year endea December 31, 2020, totaled $530,000. HAMES INC. Balance Sheets December 31, 2020 and 2019 2020 2019 Assets Cash $ 20,000 78,000 103,000 $ 201,000 50,000 125,000 (65,000) $ 311,000 $ 21,000 72,000 99,000 $ 192,000 40,000 110,000 (60,000) $ 282,000 Accounts receivable Merchandise inventory Total current assets Land Plant and equipment Less: Accumulated depreciation Total assets Liabilities Short-term debt...
Presented here are the comparative balance sheets of Hames Inc. at December 31, 2020 and 2019....
 Presented here are the comparative balance sheets of Hames Inc. at December 31, 2020 and 2019. Sales for the year ended December 31, 2020, totaled $690,000. HAMES INC. Balance Sheets December 31, 2020 and 2019 2020 2019 $ 19,000 78,000 103,000 $ 200,000 50,000 125,000 (65,000) $ 310,000 $ 20,000 72,000 99,000 $191,000 40,000 110,000 (60,000) $ 281,000 Assets Cash Accounts receivable Merchandise inventory Total current assets Land Plant and equipment Less: Accumulated depreciation Total assets Liabilities Short-term debt Accounts...
Presented here are the comparative balance sheets of Hames Inc. at December 31, 2020 and 2019....
 Presented here are the comparative balance sheets of Hames Inc. at December 31, 2020 and 2019. Sales for the year ende December 31, 2020, totaled $580,000. HAMES INC. Balance Sheets December 31, 2020 and 2019 2020 2019 $ 23,000 78,000 103,000 $ 204,000 50,000 125,000 (65,000 $314,000 $ 20,000 72,000 99,000 $191,000 40,000 110,000 (60,000) $281,000 Assets Cash Accounts receivable Merchandise inventory Total current assets Land Plant and equipment Less: Accumulated depreciation Total assets Liabilities Short-term debt Accounts payable Other...
Presented here are the comparative balance sheets of Hames Inc. at December 31, 2020 and 2019....
 Presented here are the comparative balance sheets of Hames Inc. at December 31, 2020 and 2019. Sales for the year ended December 31, 2020, totaled $580,000. HAMES INC. Balance Sheets December 31, 2020 and 2019 2020 2019 $ 23,000 78,000 103,000 $ 204,000 50,000 125,000 (65,000) $ 314,000 $ 20,000 72,000 99,000 $191,000 40,000 110,000 (60,000) $ 281,000 Assets Cash Accounts receivable Merchandise inventory Total current assets Land Plant and equipment Less: Accumulated depreciation Total assets Liabilities Short-term debt Accounts...
Presented here are the comparative balance sheets of Hames Inc. at December 31, 2020 and 2019....
 Presented here are the comparative balance sheets of Hames Inc. at December 31, 2020 and 2019. Sales for the year ended December 31, 2020, totaled $680,000 HAMES INC Balance Sheets December 31, 2020 and 2019 2020 2019 $ 23, eee 78, eee 103,000 $204, eee 50,000 125, eee (65,000) $314, eee $ 21,000 72, eee 99,000 $192,000 40,00 110,000 (60, eee) $282,000 Assets Cash Accounts receivable Merchandise inventory Total current assets Land Plant and equipment Less: Accumulated depreciation Total assets...
 Chech Presented here are the comparative balance sheets of Hames Inc. at December 31, 2020 and 2019. Sales for the year ended December 31, 2020, totaled $670,000. HAMES INC. Balance Sheets December 31, 2020 and 2019 2020 2019 $ 25,000 78,000 103,000 $ 206,000 50,000 125,000 (65,000) $ 316,000 $ 20,000 72,000 99,000 $191,000 40,000 110,000 (60,000) $ 281,000 Assets Cash Accounts receivable Merchandise inventory Total current assets Land Plant and equipment Less: Accumulated depreciation Total assets Liabilities Short-term debt...
 Presented here are the comparative balance sheets of Hames Inc. at December 31, 2020 and 2019. Sales for the year ended December 31, 2020, totaled $650,000. HAMES INC. Balance Sheets December 31, 2020 and 2019 2020 2019 $ 19,000 78,000 103,000 $ 200,000 50,000 125,000 (65,000) $ 310,000 $ 20,000 72,000 99,000 $191,000 40,000 110,000 (60,000) $ 281,000 Assets Cash Accounts receivable Merchandise inventory Total current assets Land Plant and equipment Less: Accumulated depreciation Total assets Liabilities Short-term debt Accounts...
 Presented here are the comparative balance sheets of Hames Inc. at December 31, 2020 and 2019. Sales for the year endea December 31, 2020, totaled $530,000. HAMES INC. Balance Sheets December 31, 2020 and 2019 2020 2019 Assets Cash $ 20,000 78,000 103,000 $ 201,000 50,000 125,000 (65,000) $ 311,000 $ 21,000 72,000 99,000 $ 192,000 40,000 110,000 (60,000) $ 282,000 Accounts receivable Merchandise inventory Total current assets Land Plant and equipment Less: Accumulated depreciation Total assets Liabilities Short-term debt...
 Presented here are the comparative balance sheets of Hames Inc. at December 31, 2020 and 2019. Sales for the year ended December 31, 2020, totaled $690,000. HAMES INC. Balance Sheets December 31, 2020 and 2019 2020 2019 $ 19,000 78,000 103,000 $ 200,000 50,000 125,000 (65,000) $ 310,000 $ 20,000 72,000 99,000 $191,000 40,000 110,000 (60,000) $ 281,000 Assets Cash Accounts receivable Merchandise inventory Total current assets Land Plant and equipment Less: Accumulated depreciation Total assets Liabilities Short-term debt Accounts...
 Presented here are the comparative balance sheets of Hames Inc. at December 31, 2020 and 2019. Sales for the year ende December 31, 2020, totaled $580,000. HAMES INC. Balance Sheets December 31, 2020 and 2019 2020 2019 $ 23,000 78,000 103,000 $ 204,000 50,000 125,000 (65,000 $314,000 $ 20,000 72,000 99,000 $191,000 40,000 110,000 (60,000) $281,000 Assets Cash Accounts receivable Merchandise inventory Total current assets Land Plant and equipment Less: Accumulated depreciation Total assets Liabilities Short-term debt Accounts payable Other...
 Presented here are the comparative balance sheets of Hames Inc. at December 31, 2020 and 2019. Sales for the year ended December 31, 2020, totaled $580,000. HAMES INC. Balance Sheets December 31, 2020 and 2019 2020 2019 $ 23,000 78,000 103,000 $ 204,000 50,000 125,000 (65,000) $ 314,000 $ 20,000 72,000 99,000 $191,000 40,000 110,000 (60,000) $ 281,000 Assets Cash Accounts receivable Merchandise inventory Total current assets Land Plant and equipment Less: Accumulated depreciation Total assets Liabilities Short-term debt Accounts...
 Presented here are the comparative balance sheets of Hames Inc. at December 31, 2020 and 2019. Sales for the year ended December 31, 2020, totaled $680,000 HAMES INC Balance Sheets December 31, 2020 and 2019 2020 2019 $ 23, eee 78, eee 103,000 $204, eee 50,000 125, eee (65,000) $314, eee $ 21,000 72, eee 99,000 $192,000 40,00 110,000 (60, eee) $282,000 Assets Cash Accounts receivable Merchandise inventory Total current assets Land Plant and equipment Less: Accumulated depreciation Total assets...
Most questions answered within 3 hours.
-
Where is the error in this code sequence?
String s1 = "Hello";
String s2 = "ello";...
asked 10 months ago -
Financial data for Joel de Paris, Inc., for last year
follow:
Joel de Paris, Inc.
Balance...
asked 10 months ago -
Consider this reaction:
Al2(SO4)3 (aq)+ BaCl3
(aq) Al2Cl6 (aq)- +
3BaSO4(s) . What is the...
asked 10 months ago -
Suppose that Savneet is considering increasing her
recent random sample from 20 car rentals to 40...
asked 10 months ago -
Trucks arrive at an unloading terminal at an average rate of 120
per hour.
Trucks arrive...
asked 10 months ago -
Why are methanol and ethanol completely soluble in water while
octanol is not very little soluble....
asked 10 months ago -
A facilities manager at a university reads in a research report
that the mean amount of...
asked 10 months ago -
When the CuSO4 is rehydrated by adding water to the anhydrous
compound, is this an endothermic...
asked 10 months ago -
A ray of sunlight is passing from diamond into crown glass; the
angle of incidence is...
asked 10 months ago -
A block of mass 0.249 kg is placed on top of a light, vertical
spring of...
asked 10 months ago -
how do the kidneys compensate in the presences of acidosis
a) trigger hyperventilate
b) reserve acid...
asked 10 months ago -
Question 501 pts
The rental rate of capital to the firm increases. Which of the
following...
asked 10 months ago