
Homework Answers
Add Answer to:
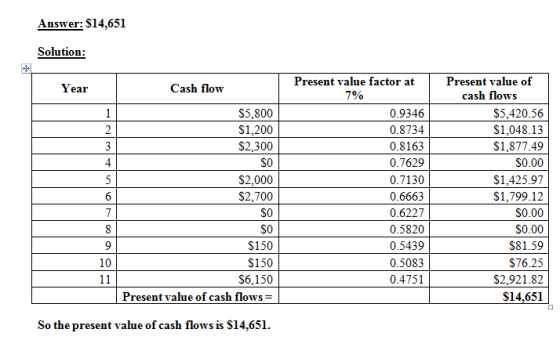
Consider the following Cash Flow diagrams: $5800 $2300 CASH FLOWA $2700 2 w $150 $150 0...
Consider the following cash flow diagrams. In these diagrams the present value (P) and the future...
 Consider the following cash flow diagrams. In these diagrams the
present value (P) and the future value (F) are economically
equivalent to the uniform series of payments (A) at a discount rate
of 8% per period. Is the value of P larger than F, equal to F, or
less than F?
QUESTION 1 Consider the following cash flow diagrams. In these diagrams the present value (P) and the future value (F) are economically equivalent to the uniform series of payments...
Consider the following cash flow diagrams. In these diagrams the
present value (P) and the future value (F) are economically
equivalent to the uniform series of payments (A) at a discount rate
of 8% per period. Is the value of P larger than F, equal to F, or
less than F?
QUESTION 1 Consider the following cash flow diagrams. In these diagrams the present value (P) and the future value (F) are economically equivalent to the uniform series of payments...
Consider the following cash flow diagrams. In these diagrams the present value (P) and the future...
 Consider the following cash flow diagrams. In these diagrams the present value (P) and the future value (F) are economically equivalent to the uniform series of payments (A) at a discount rate of 8% per period. Is the value of P larger than F, equal to F, or less than F? P is larger than F P equals F P is less than QUESTION 2 For the same cashflows considered in question 1, if the discount rate changed from 8%...
Consider a cash flow and interest profile as shown: Year 0 Year 1 Year 2 Year...
Consider a cash flow and interest profile as shown: Year 0 Year 1 Year 2 Year 3 Cash Flow at the end of the year -1000 3700 2800 1200 Interest Rate that year N.A. 4% 7% 11.5% The worth at the end of Year 3 of these cash flows is:
in engineering economic First question Consider a cash flow diagram in current value that includes 6...
 in engineering economic
First question Consider a cash flow diagram in current value that includes 6 equal end-okycar payments. The value of each payment is X. a. Calculate X, assuming the present worth is 500S) the future worth at the end of the 6th year in current value will bei 000s, and the predictable inflation is2%peryear. b. What are the payments real values? Xr 4.22
in engineering economic
First question Consider a cash flow diagram in current value that includes 6 equal end-okycar payments. The value of each payment is X. a. Calculate X, assuming the present worth is 500S) the future worth at the end of the 6th year in current value will bei 000s, and the predictable inflation is2%peryear. b. What are the payments real values? Xr 4.22
3. Consider Table 2 Table 2 Year 3 Year 4 Cash flow Year 2 Year 0 Year 1 Cash flovw Cash flow Cash flow 70 Cash flow Pr...
 3. Consider Table 2 Table 2 Year 3 Year 4 Cash flow Year 2 Year 0 Year 1 Cash flovw Cash flow Cash flow 70 Cash flow Project 80 70 30 -150 0.24 Interest Tax Shield 0.75 (a)Consider Table 2. Calculate the net present value of the project assuming it is all-equity financed. The required return on unlevered equity is 15%. (b)Consider Table 2. Assume for now that the project is financed using equal parts debt and equity. The cost...
Problem 2 of 4. 25 points) Cash flow diagrams required Use a 10-years analysis period and...
 Problem 2 of 4. 25 points) Cash flow diagrams required Use a 10-years analysis period and Net present worth analysis with 8% interest rate First Cost Uniform annual beneft Useful life in years $12.000 $2.000 10 10500 $1.800 a) Draw cash flow diagrams b) Determine best aternative. Why? c) How much does the better choice saves?
Consider the following timeline: Date 0 1 2 3 -$150 $40 $80 $100 Cash flow If...
 Consider the following timeline: Date 0 1 2 3 -$150 $40 $80 $100 Cash flow If the current market rate of interest is 12%, then the value of the cash flows in year 0 and year 2 as of year 1 is closest to: O A. $171 B. $79 C. - $70 OD. - $79
Problem Set 2 1, For each of the following annuities, calculate the annual cash flow. Cash...
 Problem Set 2 1, For each of the following annuities, calculate the annual cash flow. Cash Flow Present Value Years $32,400 6 $29,650 8 $159,500 20 $230,700 22 Interest Rate 10% 8% 13% 12% Interest Rate b, For each of the following annuities, calculate the present value. Cash Flow Present Value Years $2,250 $1,355 $12,205 $31,400 7 9 14 30 8% 7% 9% 11% Interest Rate c. For each of the following annuities, calculate the annuity payment. Cash Flow Future...
Unanswered Question 7 0/1 pts Consider the following cash flow diagram: 30,000 20,000 15,000 10,000 o...
 Unanswered Question 7 0/1 pts Consider the following cash flow diagram: 30,000 20,000 15,000 10,000 o 1 2 Using an interest rate of 10% find the value of the X below to get the present worth of the cash flow at time zero PW(O) = 25000(P/F 10%,3)+(P/G,10%.XX(P/F, 10%,1) You Answered Correct Answers 5 (with margin: 0)
? Question 3 4 pts Consider the two cash flow streams below: 0 2 Option Y:...
 ? Question 3 4 pts Consider the two cash flow streams below: 0 2 Option Y: 2,000900 -900 Option Z:-2,500 13001300 Which project has the higher IRR? Which project has the higher NPV if required return is 10.4%? O Option Y has higher IRR: Option Y has higher NPV O Option Y has higher IRR: Option Z has higher NPV O Option Z has higher IRR; Option Y has higher NPV O Option Z has higher IRR: Option Z has...
 Consider the following cash flow diagrams. In these diagrams the
present value (P) and the future value (F) are economically
equivalent to the uniform series of payments (A) at a discount rate
of 8% per period. Is the value of P larger than F, equal to F, or
less than F?
QUESTION 1 Consider the following cash flow diagrams. In these diagrams the present value (P) and the future value (F) are economically equivalent to the uniform series of payments...
Consider the following cash flow diagrams. In these diagrams the
present value (P) and the future value (F) are economically
equivalent to the uniform series of payments (A) at a discount rate
of 8% per period. Is the value of P larger than F, equal to F, or
less than F?
QUESTION 1 Consider the following cash flow diagrams. In these diagrams the present value (P) and the future value (F) are economically equivalent to the uniform series of payments...
 Consider the following cash flow diagrams. In these diagrams the present value (P) and the future value (F) are economically equivalent to the uniform series of payments (A) at a discount rate of 8% per period. Is the value of P larger than F, equal to F, or less than F? P is larger than F P equals F P is less than QUESTION 2 For the same cashflows considered in question 1, if the discount rate changed from 8%...
 in engineering economic
First question Consider a cash flow diagram in current value that includes 6 equal end-okycar payments. The value of each payment is X. a. Calculate X, assuming the present worth is 500S) the future worth at the end of the 6th year in current value will bei 000s, and the predictable inflation is2%peryear. b. What are the payments real values? Xr 4.22
in engineering economic
First question Consider a cash flow diagram in current value that includes 6 equal end-okycar payments. The value of each payment is X. a. Calculate X, assuming the present worth is 500S) the future worth at the end of the 6th year in current value will bei 000s, and the predictable inflation is2%peryear. b. What are the payments real values? Xr 4.22
 3. Consider Table 2 Table 2 Year 3 Year 4 Cash flow Year 2 Year 0 Year 1 Cash flovw Cash flow Cash flow 70 Cash flow Project 80 70 30 -150 0.24 Interest Tax Shield 0.75 (a)Consider Table 2. Calculate the net present value of the project assuming it is all-equity financed. The required return on unlevered equity is 15%. (b)Consider Table 2. Assume for now that the project is financed using equal parts debt and equity. The cost...
 Problem 2 of 4. 25 points) Cash flow diagrams required Use a 10-years analysis period and Net present worth analysis with 8% interest rate First Cost Uniform annual beneft Useful life in years $12.000 $2.000 10 10500 $1.800 a) Draw cash flow diagrams b) Determine best aternative. Why? c) How much does the better choice saves?
 Consider the following timeline: Date 0 1 2 3 -$150 $40 $80 $100 Cash flow If the current market rate of interest is 12%, then the value of the cash flows in year 0 and year 2 as of year 1 is closest to: O A. $171 B. $79 C. - $70 OD. - $79
 Problem Set 2 1, For each of the following annuities, calculate the annual cash flow. Cash Flow Present Value Years $32,400 6 $29,650 8 $159,500 20 $230,700 22 Interest Rate 10% 8% 13% 12% Interest Rate b, For each of the following annuities, calculate the present value. Cash Flow Present Value Years $2,250 $1,355 $12,205 $31,400 7 9 14 30 8% 7% 9% 11% Interest Rate c. For each of the following annuities, calculate the annuity payment. Cash Flow Future...
 Unanswered Question 7 0/1 pts Consider the following cash flow diagram: 30,000 20,000 15,000 10,000 o 1 2 Using an interest rate of 10% find the value of the X below to get the present worth of the cash flow at time zero PW(O) = 25000(P/F 10%,3)+(P/G,10%.XX(P/F, 10%,1) You Answered Correct Answers 5 (with margin: 0)
 ? Question 3 4 pts Consider the two cash flow streams below: 0 2 Option Y: 2,000900 -900 Option Z:-2,500 13001300 Which project has the higher IRR? Which project has the higher NPV if required return is 10.4%? O Option Y has higher IRR: Option Y has higher NPV O Option Y has higher IRR: Option Z has higher NPV O Option Z has higher IRR; Option Y has higher NPV O Option Z has higher IRR: Option Z has...
Most questions answered within 3 hours.
-
Where is the error in this code sequence?
String s1 = "Hello";
String s2 = "ello";...
asked 11 months ago -
Financial data for Joel de Paris, Inc., for last year
follow:
Joel de Paris, Inc.
Balance...
asked 11 months ago -
Consider this reaction:
Al2(SO4)3 (aq)+ BaCl3
(aq) Al2Cl6 (aq)- +
3BaSO4(s) . What is the...
asked 11 months ago -
Suppose that Savneet is considering increasing her
recent random sample from 20 car rentals to 40...
asked 11 months ago -
Trucks arrive at an unloading terminal at an average rate of 120
per hour.
Trucks arrive...
asked 11 months ago -
Why are methanol and ethanol completely soluble in water while
octanol is not very little soluble....
asked 11 months ago -
A facilities manager at a university reads in a research report
that the mean amount of...
asked 11 months ago -
When the CuSO4 is rehydrated by adding water to the anhydrous
compound, is this an endothermic...
asked 11 months ago -
A ray of sunlight is passing from diamond into crown glass; the
angle of incidence is...
asked 11 months ago -
A block of mass 0.249 kg is placed on top of a light, vertical
spring of...
asked 11 months ago -
how do the kidneys compensate in the presences of acidosis
a) trigger hyperventilate
b) reserve acid...
asked 11 months ago -
Question 501 pts
The rental rate of capital to the firm increases. Which of the
following...
asked 11 months ago