
Homework Answers
Add Answer to:
Question 9 (5 points) The following table reports the sale of umbrellas for 12 quarters. Quarter...
The following table reports the sale of umbrellas for 12 quarters. Quarter Year 1 Year 2...
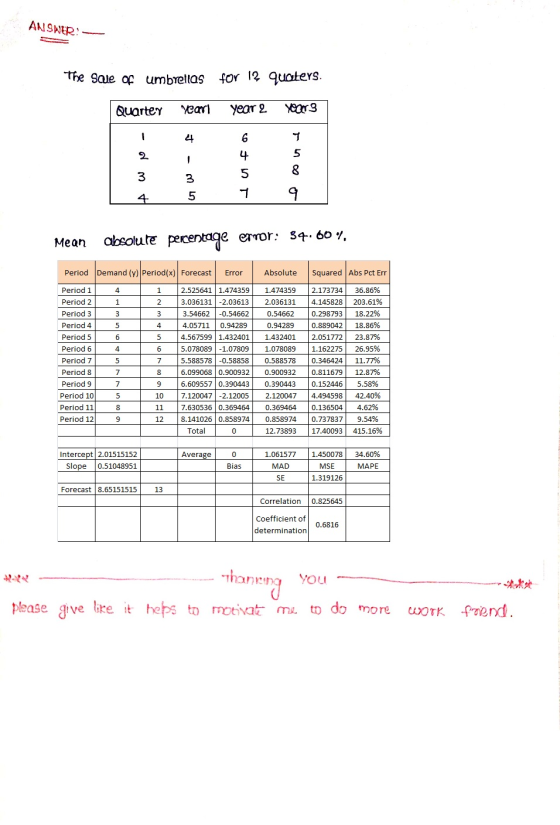
 The following table reports the sale of umbrellas for 12 quarters. Quarter Year 1 Year 2 Year 3 1 4 6 7 2 1 4 5 3 3 5 8 4 5 7 9 Develop a model using Quarter 4 as the reference year and compute the Second Quarterly sales forecast for Year 5. Round your answers to three decimal places.
Consider the following time series data. Quarter Year 1 Year 2 Year 3 1 4 6...
Consider the following time series data. Quarter Year 1 Year 2 Year 3 1 4 6 7 2 2 3 6 3 3 5 6 4 5 7 8 (b) Use a multiple regression model with dummy variables as follows to develop an equation to account for seasonal effects in the data. Qtr1 = 1 if Quarter 1, 0 otherwise; Qtr2 = 1 if Quarter 2, 0 otherwise; Qtr3 = 1 if Quarter 3, 0 otherwise. If required, round your...
A popular brand of fly fishing rods has had the following demand history by quarters for the past 16 quarters. Quarter Demand Quarter Demand 81 52 1 9 46 10 108 56 74 12 49 4 75 13 59 5 92 14 6 65 79...
 A popular brand of fly fishing rods has had the following demand history by quarters for the past 16 quarters. Quarter Demand Quarter Demand 81 52 1 9 46 10 108 56 74 12 49 4 75 13 59 5 92 14 6 65 79 102 15 7 50 60 16 73 Using the data above, forecast the demand for the next 8 quarters using Winter's Seasonal Model. Use Minitab to find a good fitting seasonal model (you must decide...
8. Examine the following quarterly data: Quarter 11 Quarter 2 2 Quarter 3 3 15 26 20 12 34 51 Quarter 44 Quarter 1 5 Quarter 2 6 Quarter 3 7 Quarter 4 8 Quarter 1 9 Quarter 2 1 38 62 Quarter 311...
 8. Examine the following quarterly data: Quarter 11 Quarter 2 2 Quarter 3 3 15 26 20 12 34 51 Quarter 44 Quarter 1 5 Quarter 2 6 Quarter 3 7 Quarter 4 8 Quarter 1 9 Quarter 2 1 38 62 Quarter 311 Quarter 4 12 84 Calculate the seasonal indexes for each quarter. a. Quarter 1 Quarter 2 Quarter 3 Quarter 4 b. Deseasonalize the time series. Produce the trend line using the deseasonalized data. Produce seasonaly adjusted...
Quarter Year 1 Year 2 Year 3 Year 4 Year 5 1 20 42 69 98...
 Quarter
Year 1
Year 2
Year 3
Year 4
Year 5
1
20
42
69
98
175
2
101
141
149
211
288
3
168
250
333
388
436
4
6
20
47
91
181
South Shore Construction builds permanent docks and seawalls along the southern shore of Long Island, New York. Although the firm has been in business only five years, revenue has increased from $295,000 in the first year of operation to $1,080,000 in the most recent year....
Quarter
Year 1
Year 2
Year 3
Year 4
Year 5
1
20
42
69
98
175
2
101
141
149
211
288
3
168
250
333
388
436
4
6
20
47
91
181
South Shore Construction builds permanent docks and seawalls along the southern shore of Long Island, New York. Although the firm has been in business only five years, revenue has increased from $295,000 in the first year of operation to $1,080,000 in the most recent year....
The following table shows the past two years of quarterly sales information. Assume that there are...
 The following table shows the past two years of quarterly sales information. Assume that there are both trend and seasonal factors and that the seasonal cycle is one year QUARTER 1 2 3 4 5 6 7 В SALES 161 191 158 136 217 234 210 170 Use time series decomposition to forecast quarterly sales for the next year. (Do not round Intermediate calculations. Round your answers to the nearest whole number) Forecast Quarter 9 10 11 12
The first quart forecast is _____ The second quarter forecast is _____ The third quarter forecast...
 The
first quart forecast is _____
The second quarter forecast is _____
The third quarter forecast is _____
The fourth quarter forecast is _____
The manager of a utility company in the Texas panhandle wants to develop quarterly forecasts of power loads for the next year. The power loads are seasonal, and the data on the quarterly loads in megawatts (MW) for the last four years are as follows: Year 1 Year 4 Year 2 98.1 Quarter Year 3 127.6...
The
first quart forecast is _____
The second quarter forecast is _____
The third quarter forecast is _____
The fourth quarter forecast is _____
The manager of a utility company in the Texas panhandle wants to develop quarterly forecasts of power loads for the next year. The power loads are seasonal, and the data on the quarterly loads in megawatts (MW) for the last four years are as follows: Year 1 Year 4 Year 2 98.1 Quarter Year 3 127.6...
3. The quarterly sales for a product line for last 3 years is as follows: Quarters: 1, 2, 3, 4, 5, 6, 7, 8, 9, 10,...
 3. The quarterly sales for a product line for last 3 years is as follows: Quarters: 1, 2, 3, 4, 5, 6, 7, 8, 9, 10, 11, 12, 600, 1550, 1500, 1500, 2400, 3100, 2600, 2900, 3800, 4500, 4000, 4900 Forecast sales for the next 4 quarters (13, 14, 15, 16)
Consider the following time series data (Insert the data in an Excel file): v QUARTER YEAR...
Consider the following time series data (Insert the data in an Excel file): v QUARTER YEAR 1 YEAR2 YEAR 3 YEAR 4 1 8 9 12 2 5 6 9 3 7 8 10 4 8 11 11 2.1. Construct a time series plot. What type of pattern exists in the data? 2.2. Use a multiple regression model with dummy variables as follows to develop an equation to account for seasonal effects in the data. Qtr1=1 if quarter 1, 0...
Here are earnings per share for two companies by quarter from the first quarter of three...
Here are earnings per share for two companies by quarter from the first quarter of three years ago through the second quarter of this year. Forecast earnings per share for the rest of this year and next year. Use exponential smoothing to forecast the third period of this year, and the time series decomposition method to forecast the last two quarters of this year and all four quarters of next year. (It is much easier to solve this problem on...
 The following table reports the sale of umbrellas for 12 quarters. Quarter Year 1 Year 2 Year 3 1 4 6 7 2 1 4 5 3 3 5 8 4 5 7 9 Develop a model using Quarter 4 as the reference year and compute the Second Quarterly sales forecast for Year 5. Round your answers to three decimal places.
 A popular brand of fly fishing rods has had the following demand history by quarters for the past 16 quarters. Quarter Demand Quarter Demand 81 52 1 9 46 10 108 56 74 12 49 4 75 13 59 5 92 14 6 65 79 102 15 7 50 60 16 73 Using the data above, forecast the demand for the next 8 quarters using Winter's Seasonal Model. Use Minitab to find a good fitting seasonal model (you must decide...
 8. Examine the following quarterly data: Quarter 11 Quarter 2 2 Quarter 3 3 15 26 20 12 34 51 Quarter 44 Quarter 1 5 Quarter 2 6 Quarter 3 7 Quarter 4 8 Quarter 1 9 Quarter 2 1 38 62 Quarter 311 Quarter 4 12 84 Calculate the seasonal indexes for each quarter. a. Quarter 1 Quarter 2 Quarter 3 Quarter 4 b. Deseasonalize the time series. Produce the trend line using the deseasonalized data. Produce seasonaly adjusted...
 Quarter
Year 1
Year 2
Year 3
Year 4
Year 5
1
20
42
69
98
175
2
101
141
149
211
288
3
168
250
333
388
436
4
6
20
47
91
181
South Shore Construction builds permanent docks and seawalls along the southern shore of Long Island, New York. Although the firm has been in business only five years, revenue has increased from $295,000 in the first year of operation to $1,080,000 in the most recent year....
Quarter
Year 1
Year 2
Year 3
Year 4
Year 5
1
20
42
69
98
175
2
101
141
149
211
288
3
168
250
333
388
436
4
6
20
47
91
181
South Shore Construction builds permanent docks and seawalls along the southern shore of Long Island, New York. Although the firm has been in business only five years, revenue has increased from $295,000 in the first year of operation to $1,080,000 in the most recent year....
 The following table shows the past two years of quarterly sales information. Assume that there are both trend and seasonal factors and that the seasonal cycle is one year QUARTER 1 2 3 4 5 6 7 В SALES 161 191 158 136 217 234 210 170 Use time series decomposition to forecast quarterly sales for the next year. (Do not round Intermediate calculations. Round your answers to the nearest whole number) Forecast Quarter 9 10 11 12
 The
first quart forecast is _____
The second quarter forecast is _____
The third quarter forecast is _____
The fourth quarter forecast is _____
The manager of a utility company in the Texas panhandle wants to develop quarterly forecasts of power loads for the next year. The power loads are seasonal, and the data on the quarterly loads in megawatts (MW) for the last four years are as follows: Year 1 Year 4 Year 2 98.1 Quarter Year 3 127.6...
The
first quart forecast is _____
The second quarter forecast is _____
The third quarter forecast is _____
The fourth quarter forecast is _____
The manager of a utility company in the Texas panhandle wants to develop quarterly forecasts of power loads for the next year. The power loads are seasonal, and the data on the quarterly loads in megawatts (MW) for the last four years are as follows: Year 1 Year 4 Year 2 98.1 Quarter Year 3 127.6...
 3. The quarterly sales for a product line for last 3 years is as follows: Quarters: 1, 2, 3, 4, 5, 6, 7, 8, 9, 10, 11, 12, 600, 1550, 1500, 1500, 2400, 3100, 2600, 2900, 3800, 4500, 4000, 4900 Forecast sales for the next 4 quarters (13, 14, 15, 16)
Most questions answered within 3 hours.
-
Where is the error in this code sequence?
String s1 = "Hello";
String s2 = "ello";...
asked 10 months ago -
Financial data for Joel de Paris, Inc., for last year
follow:
Joel de Paris, Inc.
Balance...
asked 10 months ago -
Consider this reaction:
Al2(SO4)3 (aq)+ BaCl3
(aq) Al2Cl6 (aq)- +
3BaSO4(s) . What is the...
asked 10 months ago -
Suppose that Savneet is considering increasing her
recent random sample from 20 car rentals to 40...
asked 10 months ago -
Trucks arrive at an unloading terminal at an average rate of 120
per hour.
Trucks arrive...
asked 10 months ago -
Why are methanol and ethanol completely soluble in water while
octanol is not very little soluble....
asked 10 months ago -
A facilities manager at a university reads in a research report
that the mean amount of...
asked 10 months ago -
When the CuSO4 is rehydrated by adding water to the anhydrous
compound, is this an endothermic...
asked 10 months ago -
A ray of sunlight is passing from diamond into crown glass; the
angle of incidence is...
asked 10 months ago -
A block of mass 0.249 kg is placed on top of a light, vertical
spring of...
asked 10 months ago -
how do the kidneys compensate in the presences of acidosis
a) trigger hyperventilate
b) reserve acid...
asked 10 months ago -
Question 501 pts
The rental rate of capital to the firm increases. Which of the
following...
asked 10 months ago