Here are the expected returns and risks of two portfolios – a domestic and a foreign:...
Here are the expected returns and risks of two portfolios – a domestic and a foreign:
E(r domestic) = 12% σdomestic = 10%
E(r foreign) = 16% σforeign = 12%
a. Assume a correlation of 0.5 and draw all the portfolios made up of the two assets in
an Expected Return/Risk graph.
b. Repeat the procedure in part (a) assuming a correlation of -1, 0, and +1.
c. Looking at the four graphs, what do you conclude about the importance of correlation
in risk-reduction?
d. Comment on the advantages and disadvantages of international diversification
Please solve in Excel
Please also show how you have graphed
Please teach how to make the graphs however possible
Homework Answers
a]
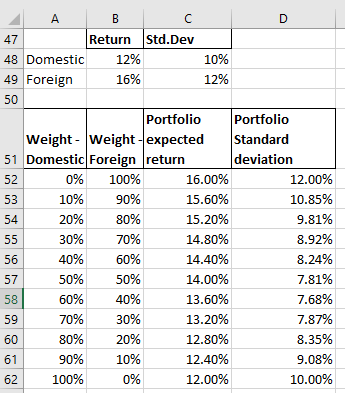
Expected return of two-asset portfolio Rp = w1R1 + w2R2,
where Rp = expected return
w1 = weight of Asset 1
R1 = expected return of Asset 1
w2 = weight of Asset 2
R2 = expected return of Asset 2
Standard deviation for a two-asset portfolio σp = w12σ12 + w22σ22 + 2w1w2Cov1,2
where σp = Standard deviation of the portfolio
w1 = weight of Asset 1
w2 = weight of Asset 2
σ1 = Standard deviation of Asset 1
σ2 = Standard deviation of Asset 2
Cov1,2 = covariance of returns between Asset 1 and Asset 2
Cov1,2 = ρ1,2 * σ1 * σ2, where ρ1,2 = correlation of returns between Asset 1 and Asset 2
The expected return and standard deviation are calculated as below :


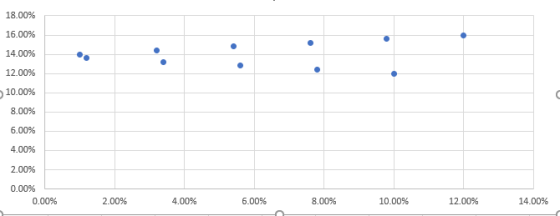
Return/Risk graph is below :

b]
Correlation of 1

the 
The risk return graph is below :

Correlation of 0

The risk return graph is below :

Correlation of -1


The graphs are done using with these steps :
- Select (using the mouse) the table containing the data expected return and standard deviation only. For example, for the first graph, C5 : D16 is selected
- Click on "Insert" Tab on the top
- In "Charts", select the last option --> "Scatter" Charts and then the first option --> "Scatter"
- This should display the graph
c]
It can be concluded that lower the correlation, lower the portfolio risk
d]
Advantages of international diversification are :
- More opportunities for growth
- Provides diversification benefit to portfolio
- Reduces country specific risk of home country
Disadvantages of international diversification are :
- Exposes the portfolio to foreign exchange risk
- Exposes the portfolio to country specific risk of foreign country
- Liquidity may be lower in foreign markets
Add Answer to:
Here are the expected returns and risks of two portfolios – a
domestic and a foreign:...
Here are the expected returns and risks of two portfolios – a domestic and a foreign:...
Here are the expected returns and risks of two portfolios – a domestic and a foreign: E(r domestic) = 12% σdomestic = 10% E(r foreign) = 16% σforeign = 12% a. Assume a correlation of 0.5 and draw all the portfolios made up of the two assets in an Expected Return/Risk graph. b. Repeat the procedure in part (a) assuming a correlation of -1, 0, and +1. c. Looking at the four graphs, what do you conclude about the importance...
15. How does the diversification of a portfolio change its expected returns and expected risks? Is...
 15. How does the diversification of a portfolio change its expected returns and expected risks? Is this in principle any different for internationally diversified portfolios? 16. What types of risk are present in a diversified portfolio? Which type of risk remains after the portfolio has been diversified? 17. If all national markets have market risk, is all market risk the same? 18. If an investor is able to determine a global beta for his portfolio and holds a portfolio that...
Assume that the domestic and foreign assets have standard deviations of od= 16% and of=19%, respectively,...
 Assume that the domestic and foreign assets have standard deviations of od= 16% and of=19%, respectively, with a correlation of pur=0.6. The risk-free rate is equal to 5% in both countries. The expected returns of the domestic and foreign assets are both equal to 10%, E(Rd) = E(R4) = 10%. Please show your calculations/cell formulas, explain your answer in answering the following questions (a, b, c): a. True or False: The Sharpe ratio for the domestic asset is 0.313 and...
12. (10 pts: 4+6) Suppose that risks σ and mean returns μ of all portfolios corresponding to the minimal variance line satisfy the equation: σ-V'20μ2-411+ 0.29. (a) Find the expected return a...
 12. (10 pts: 4+6) Suppose that risks σ and mean returns μ of all portfolios corresponding to the minimal variance line satisfy the equation: σ-V'20μ2-411+ 0.29. (a) Find the expected return and risk of the minimum variance portfolio. (b) Assume that there is a riskless security with return R 0.07. Find the capital market line and the risk of the market portfolio
12. (10 pts: 4+6) Suppose that risks σ and mean returns μ of all portfolios corresponding to the...
12. (10 pts: 4+6) Suppose that risks σ and mean returns μ of all portfolios corresponding to the minimal variance line satisfy the equation: σ-V'20μ2-411+ 0.29. (a) Find the expected return and risk of the minimum variance portfolio. (b) Assume that there is a riskless security with return R 0.07. Find the capital market line and the risk of the market portfolio
12. (10 pts: 4+6) Suppose that risks σ and mean returns μ of all portfolios corresponding to the...
Can anyone answer the question and explain it thx alot 8. Foreign direct investment would be...
 Can anyone answer the question and explain it thx alot
8. Foreign direct investment would be the acquisition abroad by the MNC of a) sales offices b) distribution channels c) plant and equipment d) portfolio securities 9. The most important element in determining whether and how a firm should expand overseas is a) the degree of government subsidies and protection provided b) whether the firm's competitive advantages can be transferred abroad and how this can best be done c) the...
Can anyone answer the question and explain it thx alot
8. Foreign direct investment would be the acquisition abroad by the MNC of a) sales offices b) distribution channels c) plant and equipment d) portfolio securities 9. The most important element in determining whether and how a firm should expand overseas is a) the degree of government subsidies and protection provided b) whether the firm's competitive advantages can be transferred abroad and how this can best be done c) the...
Suppose stock returns can be explained by a two-factor model. The firm-specific risks for all stocks...
 Suppose stock returns can be explained by a two-factor model. The firm-specific risks for all stocks are independent. The following table shows the information for two diversified portfolios: B1 B2 E(R Portfolio 80 1.10 14% A Portfolio 1.40 -20 12 If the risk-free rate is 5 percent, what are the risk premiums for each factor in this model? (Do not round intermediate calculations and enter your answers as a percent rounded to 2 decimal places, e.g., 32.16.) Factor F1 Factor...
Dr. INVESTCO a young CEO who holds an MBA from the “MINI MOUSE” University understands completely...
Dr. INVESTCO a young CEO who holds an MBA from the “MINI MOUSE” University understands completely the concept of International Diversification and especially the concept of risk minimization. However, he/she forgot all the formulae and cannot compute the following risk-return results. Please help him/her to compute the following relationships: TIME R [Nestle] R [Myers] Probability 2016 14% 35% 0.2 2017 17 24 0.3 2018 16 28 0.3 2019 19 32 0.2 a. Calculate the Expected...
please answer question #1 7 1. You are given the following equilibrium expected returns and risks...
 please answer question #1
7 1. You are given the following equilibrium expected returns and risks E(R) - 12.2%; E(Re) - 15.5% BA -0.7; Be-1.25. c( 0.460.0615 a. What is the equation of the Security Market Line? b. A portfolio, made up of A (above) and another security, has a beta of 1.10 and expected return of 13%. Which one would you rather buy - A alone or the portfolio? Why? Ee19. 6 - OVAL BYA c. Given the SML...
please answer question #1
7 1. You are given the following equilibrium expected returns and risks E(R) - 12.2%; E(Re) - 15.5% BA -0.7; Be-1.25. c( 0.460.0615 a. What is the equation of the Security Market Line? b. A portfolio, made up of A (above) and another security, has a beta of 1.10 and expected return of 13%. Which one would you rather buy - A alone or the portfolio? Why? Ee19. 6 - OVAL BYA c. Given the SML...
PROBLEM i Create a column of monthly returns for your 2 stocks and the following 3...
 PROBLEM i Create a column of monthly returns for your 2 stocks and the following 3 portfolios. Organize your spreadsheet as follows: a. Date VRSN (#1) Portfolio 1 80% in A 20% in B Portfolio 2 50% in A 50% in B Portfolio 3 20% in A 80% in B MNST (#2) S&P 500 X.x X.x Xx Xx Xx b. Calculate the historical average return and standard deviation for your stocks and the portfolios. Recall you are using historical data,...
 15. How does the diversification of a portfolio change its expected returns and expected risks? Is this in principle any different for internationally diversified portfolios? 16. What types of risk are present in a diversified portfolio? Which type of risk remains after the portfolio has been diversified? 17. If all national markets have market risk, is all market risk the same? 18. If an investor is able to determine a global beta for his portfolio and holds a portfolio that...
 Assume that the domestic and foreign assets have standard deviations of od= 16% and of=19%, respectively, with a correlation of pur=0.6. The risk-free rate is equal to 5% in both countries. The expected returns of the domestic and foreign assets are both equal to 10%, E(Rd) = E(R4) = 10%. Please show your calculations/cell formulas, explain your answer in answering the following questions (a, b, c): a. True or False: The Sharpe ratio for the domestic asset is 0.313 and...
 12. (10 pts: 4+6) Suppose that risks σ and mean returns μ of all portfolios corresponding to the minimal variance line satisfy the equation: σ-V'20μ2-411+ 0.29. (a) Find the expected return and risk of the minimum variance portfolio. (b) Assume that there is a riskless security with return R 0.07. Find the capital market line and the risk of the market portfolio
12. (10 pts: 4+6) Suppose that risks σ and mean returns μ of all portfolios corresponding to the...
12. (10 pts: 4+6) Suppose that risks σ and mean returns μ of all portfolios corresponding to the minimal variance line satisfy the equation: σ-V'20μ2-411+ 0.29. (a) Find the expected return and risk of the minimum variance portfolio. (b) Assume that there is a riskless security with return R 0.07. Find the capital market line and the risk of the market portfolio
12. (10 pts: 4+6) Suppose that risks σ and mean returns μ of all portfolios corresponding to the...
 Can anyone answer the question and explain it thx alot
8. Foreign direct investment would be the acquisition abroad by the MNC of a) sales offices b) distribution channels c) plant and equipment d) portfolio securities 9. The most important element in determining whether and how a firm should expand overseas is a) the degree of government subsidies and protection provided b) whether the firm's competitive advantages can be transferred abroad and how this can best be done c) the...
Can anyone answer the question and explain it thx alot
8. Foreign direct investment would be the acquisition abroad by the MNC of a) sales offices b) distribution channels c) plant and equipment d) portfolio securities 9. The most important element in determining whether and how a firm should expand overseas is a) the degree of government subsidies and protection provided b) whether the firm's competitive advantages can be transferred abroad and how this can best be done c) the...
 Suppose stock returns can be explained by a two-factor model. The firm-specific risks for all stocks are independent. The following table shows the information for two diversified portfolios: B1 B2 E(R Portfolio 80 1.10 14% A Portfolio 1.40 -20 12 If the risk-free rate is 5 percent, what are the risk premiums for each factor in this model? (Do not round intermediate calculations and enter your answers as a percent rounded to 2 decimal places, e.g., 32.16.) Factor F1 Factor...
 please answer question #1
7 1. You are given the following equilibrium expected returns and risks E(R) - 12.2%; E(Re) - 15.5% BA -0.7; Be-1.25. c( 0.460.0615 a. What is the equation of the Security Market Line? b. A portfolio, made up of A (above) and another security, has a beta of 1.10 and expected return of 13%. Which one would you rather buy - A alone or the portfolio? Why? Ee19. 6 - OVAL BYA c. Given the SML...
please answer question #1
7 1. You are given the following equilibrium expected returns and risks E(R) - 12.2%; E(Re) - 15.5% BA -0.7; Be-1.25. c( 0.460.0615 a. What is the equation of the Security Market Line? b. A portfolio, made up of A (above) and another security, has a beta of 1.10 and expected return of 13%. Which one would you rather buy - A alone or the portfolio? Why? Ee19. 6 - OVAL BYA c. Given the SML...
 PROBLEM i Create a column of monthly returns for your 2 stocks and the following 3 portfolios. Organize your spreadsheet as follows: a. Date VRSN (#1) Portfolio 1 80% in A 20% in B Portfolio 2 50% in A 50% in B Portfolio 3 20% in A 80% in B MNST (#2) S&P 500 X.x X.x Xx Xx Xx b. Calculate the historical average return and standard deviation for your stocks and the portfolios. Recall you are using historical data,...
Most questions answered within 3 hours.
-
Where is the error in this code sequence?
String s1 = "Hello";
String s2 = "ello";...
asked 10 months ago -
Financial data for Joel de Paris, Inc., for last year
follow:
Joel de Paris, Inc.
Balance...
asked 10 months ago -
Consider this reaction:
Al2(SO4)3 (aq)+ BaCl3
(aq) Al2Cl6 (aq)- +
3BaSO4(s) . What is the...
asked 10 months ago -
Suppose that Savneet is considering increasing her
recent random sample from 20 car rentals to 40...
asked 10 months ago -
Trucks arrive at an unloading terminal at an average rate of 120
per hour.
Trucks arrive...
asked 10 months ago -
Why are methanol and ethanol completely soluble in water while
octanol is not very little soluble....
asked 10 months ago -
A facilities manager at a university reads in a research report
that the mean amount of...
asked 10 months ago -
When the CuSO4 is rehydrated by adding water to the anhydrous
compound, is this an endothermic...
asked 10 months ago -
A ray of sunlight is passing from diamond into crown glass; the
angle of incidence is...
asked 10 months ago -
A block of mass 0.249 kg is placed on top of a light, vertical
spring of...
asked 10 months ago -
how do the kidneys compensate in the presences of acidosis
a) trigger hyperventilate
b) reserve acid...
asked 10 months ago -
Question 501 pts
The rental rate of capital to the firm increases. Which of the
following...
asked 10 months ago