The following table is for a wind turbine:
- Calculate the Annual Energy production (AEP) using the measured wind data.
- Calculate the Annual Energy production (AEP) using the Rayleigh distribution.
- Calculate the error incurred, compared to (a) when using the Rayleigh distribution under (b).
![U [m/s] 0.00 power [kW] SNIUI 7.50 1735 2050 2000 17.50 2050 2050 2050 2050 19.50 22.00 Table 2: turbine power production vs.](http://img.homeworklib.com/questions/7c3d1120-2812-11eb-bd0a-e7e982e35865.png?x-oss-process=image/resize,w_560)
Homework Answers
| Power, P_i (kW) | Speed, u_i (m/s) | C | 2v/c^2 | (v/c)^2 | f(V) | sum(p(u)f(v)) | Turbine power (kW) | |
| 0 | 0 | 11.386 | 0.000 | 0.000 | 0 | 0 | 1151.584938 | |
| 0 | 0.5 | 11.386 | 0.008 | 0.002 | 0.007698241 | 0 | ||
| 2 | 1.5 | 11.386 | 0.023 | 0.017 | 0.022741192 | 0.045482385 | ||
| 9 | 2.5 | 11.386 | 0.039 | 0.048 | 0.036750475 | 0.330754273 | ||
| 67 | 3.5 | 11.386 | 0.054 | 0.094 | 0.049123856 | 3.291298356 | ||
| 129 | 4.5 | 11.386 | 0.069 | 0.156 | 0.059379819 | 7.659996618 | ||
| 226 | 5.5 | 11.386 | 0.085 | 0.233 | 0.067187964 | 15.18447977 | ||
| 398 | 6.5 | 11.386 | 0.100 | 0.326 | 0.072384415 | 28.80899708 | ||
| 666 | 7.5 | 11.386 | 0.116 | 0.434 | 0.074971532 | 49.93104005 | ||
| 1015 | 8.5 | 11.386 | 0.131 | 0.557 | 0.075103113 | 76.22966018 | ||
| 1397 | 9.5 | 11.386 | 0.147 | 0.696 | 0.07305787 | 102.0618439 | ||
| 1735 | 10.5 | 11.386 | 0.162 | 0.850 | 0.069205015 | 120.0707012 | ||
| 1957 | 11.5 | 11.386 | 0.177 | 1.020 | 0.063966335 | 125.182117 | ||
| 2050 | 12.5 | 11.386 | 0.193 | 1.205 | 0.057778928 | 118.4468032 | ||
| 2050 | 13.5 | 11.386 | 0.208 | 1.406 | 0.051062206 | 104.6775213 | ||
| 2050 | 14.5 | 11.386 | 0.224 | 1.622 | 0.044191691 | 90.5929667 | ||
| 2050 | 15.5 | 11.386 | 0.239 | 1.853 | 0.037481039 | 76.83613005 | ||
| 2050 | 16.5 | 11.386 | 0.255 | 2.100 | 0.031172502 | 63.90362887 | ||
| 2050 | 17.5 | 11.386 | 0.270 | 2.362 | 0.025435135 | 52.14202631 | ||
| 2050 | 18.5 | 11.386 | 0.285 | 2.640 | 0.020369318 | 41.75710197 | ||
| 2050 | 19.5 | 11.386 | 0.301 | 2.933 | 0.0160158 | 32.8323891 | ||
| 2050 | 22 | 11.386 | 0.339 | 3.733 | 0.008117073 | 41.59999968 | ||
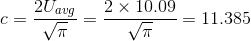
| Average | 1184.136364 | U_avg=10.0909091 |

(a) The Annual Energy Production (AEP) of the wing turbine by using the nominal method is given below:
The nominal power is the power corresponding to the nominal velocity. The nominal velocity is the velocity at which the power output of the turbine becomes almost constant.
Walker (2011) have given the following formula for calculating the power output of the turbine
 (1)
(1)
where  as calculated above in the table.
Nominal velocity can be obtain from the graph as shown above or table given above which is:

and  (using table)
 is the initial velocity,
Thus,
Hence the AEP is given by:
 (2)
(2)
 (3)
(3)
which is the required result.
(b) AEP using the Rayleigh method.
The Rayleigh distribution of the average velocity is given by:
 (4)
(4)
Where,shape factor in case of Rayleigh
distribution  is substituted in weibull distribution,
also, The scale factor, c is given by:
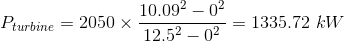
The Turbine Power output is given by:
 (5)
(5)
The value of this power output of turbine is calculated in the table as shown above in the 9th column given by:

Now using equation (2) we have


Which is the required result.
(C)The error incured in method A compared to Rayleigh method in B is given as:

Also,

Add Answer to:
The following table is for a wind turbine:
Calculate the Annual Energy production (AEP) using the...
MIET 2480-Renewable Energy Systems-15 Jun 2019 Quiz 2: Wind Power Adeol Summanleknl Name: Student ID: 1....
 MIET 2480-Renewable Energy Systems-15 Jun 2019 Quiz 2: Wind Power Adeol Summanleknl Name: Student ID: 1. You have a wind site with average wind speed of 8.2 m/s over 1 year, how the average power density in the wind is calculated, given density of the wind as 1.225 kg/m3? a. (1.225) (8.23) -338 W/m2 b. The estimated value closest to the actual average power density is calculated knowing the wind speed frequency distribution fi for each wind speed vi measured...
1 A renewable energy electricity supply technology has the following characteristics: Capital cost ($) Annual operating...
1 A renewable energy electricity supply technology has the following characteristics: Capital cost ($) Annual operating cost ($) Lifetime (years) Salvage value ($) Annual electricity supplied (MWh) 300 000 27 200 25 40 000 400 1.1 If the owner can sell the electricity at 25 c/kWh, what is the simple payback period for the technology? 1.2 Would the owner invest in this technology if (s)he set a strict maximum four-year payback period? 1.3 What would the selling price for the...
Read the Article posted below, then answer the following questions: Mergers & acquisitions are a major...
 Read the Article posted below, then answer the following
questions:
Mergers & acquisitions are a major form of
corporate diversification strategy, identify and discuss the top
three reasons why most (50-60%) of acquisitions fail to create
shareholder value.
What are the five major components of “CEMEX
Way” and why has this approach been so successful in
post-acquisition integration?
In your opinion, what can other companies learn from
the “CEMEX Way” as a benchmark for acquisition
management?
Article:
CEMEX: Globalization "The...
Read the Article posted below, then answer the following
questions:
Mergers & acquisitions are a major form of
corporate diversification strategy, identify and discuss the top
three reasons why most (50-60%) of acquisitions fail to create
shareholder value.
What are the five major components of “CEMEX
Way” and why has this approach been so successful in
post-acquisition integration?
In your opinion, what can other companies learn from
the “CEMEX Way” as a benchmark for acquisition
management?
Article:
CEMEX: Globalization "The...
 MIET 2480-Renewable Energy Systems-15 Jun 2019 Quiz 2: Wind Power Adeol Summanleknl Name: Student ID: 1. You have a wind site with average wind speed of 8.2 m/s over 1 year, how the average power density in the wind is calculated, given density of the wind as 1.225 kg/m3? a. (1.225) (8.23) -338 W/m2 b. The estimated value closest to the actual average power density is calculated knowing the wind speed frequency distribution fi for each wind speed vi measured...
 Read the Article posted below, then answer the following
questions:
Mergers & acquisitions are a major form of
corporate diversification strategy, identify and discuss the top
three reasons why most (50-60%) of acquisitions fail to create
shareholder value.
What are the five major components of “CEMEX
Way” and why has this approach been so successful in
post-acquisition integration?
In your opinion, what can other companies learn from
the “CEMEX Way” as a benchmark for acquisition
management?
Article:
CEMEX: Globalization "The...
Read the Article posted below, then answer the following
questions:
Mergers & acquisitions are a major form of
corporate diversification strategy, identify and discuss the top
three reasons why most (50-60%) of acquisitions fail to create
shareholder value.
What are the five major components of “CEMEX
Way” and why has this approach been so successful in
post-acquisition integration?
In your opinion, what can other companies learn from
the “CEMEX Way” as a benchmark for acquisition
management?
Article:
CEMEX: Globalization "The...
Most questions answered within 3 hours.
-
Where is the error in this code sequence?
String s1 = "Hello";
String s2 = "ello";...
asked 10 months ago -
Financial data for Joel de Paris, Inc., for last year
follow:
Joel de Paris, Inc.
Balance...
asked 10 months ago -
Consider this reaction:
Al2(SO4)3 (aq)+ BaCl3
(aq) Al2Cl6 (aq)- +
3BaSO4(s) . What is the...
asked 10 months ago -
Suppose that Savneet is considering increasing her
recent random sample from 20 car rentals to 40...
asked 10 months ago -
Trucks arrive at an unloading terminal at an average rate of 120
per hour.
Trucks arrive...
asked 10 months ago -
Why are methanol and ethanol completely soluble in water while
octanol is not very little soluble....
asked 10 months ago -
A facilities manager at a university reads in a research report
that the mean amount of...
asked 10 months ago -
When the CuSO4 is rehydrated by adding water to the anhydrous
compound, is this an endothermic...
asked 10 months ago -
A ray of sunlight is passing from diamond into crown glass; the
angle of incidence is...
asked 10 months ago -
A block of mass 0.249 kg is placed on top of a light, vertical
spring of...
asked 10 months ago -
how do the kidneys compensate in the presences of acidosis
a) trigger hyperventilate
b) reserve acid...
asked 10 months ago -
Question 501 pts
The rental rate of capital to the firm increases. Which of the
following...
asked 10 months ago