The ACT math scores of 15 high school seniors are listed below. 18, 15, 25, 24,...
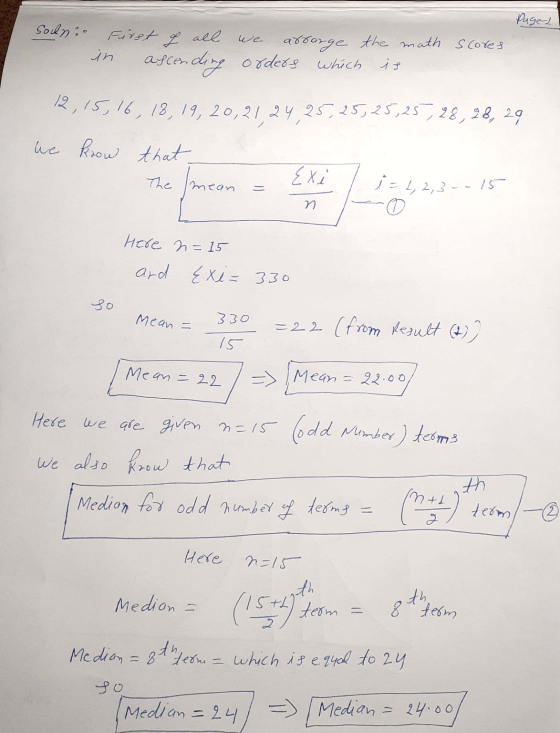
The ACT math scores of 15 high school seniors are listed below. 18, 15, 25, 24, 21, 16, 12, 20, 19, 25, 28, 25, 25, 29, 28 What is the mean?
Round your answer to 2 decimal places.)
What is the median?
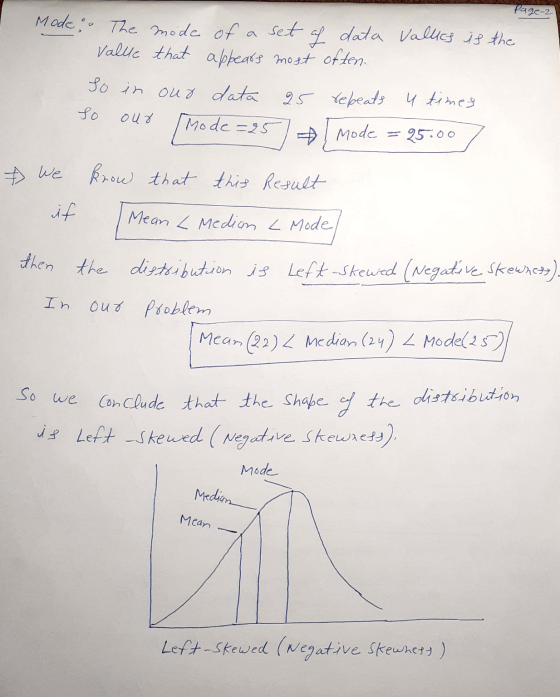
What is the mode?
Describe the approximate shape of the distribution.
Select an answer
Homework Answers
Add Answer to:
The ACT math scores of 15 high school seniors are listed below.
18, 15, 25, 24,...
The following sample information is given concerning the ACT scores of high school seniors form two...
The following sample information is given concerning the ACT scores of high school seniors form two local schools. School A School B = 12 = 15 = 25 = 23 = 19 = 13 At 95% confidence what is the marginal of error of the interval estimate for the difference between the two populations? Please keep three decimal points of your answer.
For the following set of scores, calculate the mean, median, and mode, and describe the shape...
For the following set of scores, calculate the mean, median, and mode, and describe the shape of the distribution. 16, 18, 21, 20, 17, 18, 16, 18, 19, 15, 17, 19, 20, 18, 17, 19
13. 10 pts. The following are the math SAT scores of 15 high school seniors from...
 13. 10 pts. The following are the math SAT scores of 15 high school seniors from three different high schools. Apply the Kruskal-Wallis test to determine whether there is a difference in SAT scores between the three high schools using a 0.05: . School 1: 498, 582, 527, 480, 549 . School 2: 435, 360, 372, 413, 512 . School 3: 608, 515, 661, 637, 554
1. Suppose the scores for high school seniors on the verbal portion of the SAT test...
1. Suppose the scores for high school seniors on the verbal portion of the SAT test have a population mean of 509 and a population standard deviation of 112. a. List the population and the variable. b. What do you know about the population distribution of SAT scores for high school seniors? (i.e. shape, center, spread) c. Suppose we randomly select 56 high school seniors from this population. What would you expect the shape, mean and standard deviation of the...
IQ scores of college bound seniors in high school has the normal distribution with a mean...
IQ scores of college bound seniors in high school has the normal distribution with a mean 100 and standard deviation of 15. what is the IQ score at 2 standard deviation above the mean?
15) Last year at Townsburg High School, 42% of the graduating seniors took the ACT exam,...
15) Last year at Townsburg High School, 42% of the graduating seniors took the ACT exam, 38% of the graduating seniors took the SAT exam, and 23% of graduating seniors too both exams. A student is selected at random. If the student took the ACT, what is the probability that they also took the SAT? Round your answer to four decimal places.
5. At a local high school 5000 juniors and seniors recently took an aptitude test. The...
 5. At a local high school 5000 juniors and seniors recently took an aptitude test. The results of the exam were normally distributed with mean = 450 and o = 50. Calculate the following: a. The PERCENT of students to the nearest tenth of a percent that scored over 425 b. The number of students that scored more than 475 C. The probability of a student selected at random having scored between 400 and 575 6. A statistics instructor recorded...
For the data listed(assume sample). a.) Find the following: Mean Mode Median Midrange Range Quartiles Variance...
For the data listed(assume sample). a.) Find the following: Mean Mode Median Midrange Range Quartiles Variance Standard Deviation BoxPlot b.) Create a frequency distribution When creating classes use the formula from the Notes on how classes to create. 17 23 14 16 12 26 20 22 14 15 22 18 18 21 21 19 15 21 18 17 15 25 14 30 16 10 20 12 16 17.44 16 14 15 20 20 16 17 16 15 15 19 48...
4. You want to estimate the mean SATM score for 250,000 high school seniors in California. Only a...
 4. You want to estimate the mean SATM score for 250,000 high school seniors in California. Only about 45% of California students take the SAT. These self-selected students are planning to attend college and are not representative of all California seniors A simple random sample (SRS) of 500 California high school seniors is tested. The mean score of the sample is Y 461. What could you say about the mean score, n-508 in the population of all 250,000 seniors? Assume...
A group of high school seniors took a scholastic aptitude test. The resulting math scores had...
 A group of high school seniors took a scholastic aptitude test. The resulting math scores had a mean 527.8 with a standard deviation of 177.8, verbal mean 505.5 with a standard deviation of 147.3, and the correlation between verbal and math scores was r=0.521. Complete parts a through f below. a) What is the correlation? The correlation is Round to three decimal places as needed.) b) Write the equation of the line of regression predicting verbal scores from math scores....
 13. 10 pts. The following are the math SAT scores of 15 high school seniors from three different high schools. Apply the Kruskal-Wallis test to determine whether there is a difference in SAT scores between the three high schools using a 0.05: . School 1: 498, 582, 527, 480, 549 . School 2: 435, 360, 372, 413, 512 . School 3: 608, 515, 661, 637, 554
 5. At a local high school 5000 juniors and seniors recently took an aptitude test. The results of the exam were normally distributed with mean = 450 and o = 50. Calculate the following: a. The PERCENT of students to the nearest tenth of a percent that scored over 425 b. The number of students that scored more than 475 C. The probability of a student selected at random having scored between 400 and 575 6. A statistics instructor recorded...
 4. You want to estimate the mean SATM score for 250,000 high school seniors in California. Only about 45% of California students take the SAT. These self-selected students are planning to attend college and are not representative of all California seniors A simple random sample (SRS) of 500 California high school seniors is tested. The mean score of the sample is Y 461. What could you say about the mean score, n-508 in the population of all 250,000 seniors? Assume...
 A group of high school seniors took a scholastic aptitude test. The resulting math scores had a mean 527.8 with a standard deviation of 177.8, verbal mean 505.5 with a standard deviation of 147.3, and the correlation between verbal and math scores was r=0.521. Complete parts a through f below. a) What is the correlation? The correlation is Round to three decimal places as needed.) b) Write the equation of the line of regression predicting verbal scores from math scores....
Most questions answered within 3 hours.
-
Where is the error in this code sequence?
String s1 = "Hello";
String s2 = "ello";...
asked 11 months ago -
Financial data for Joel de Paris, Inc., for last year
follow:
Joel de Paris, Inc.
Balance...
asked 11 months ago -
Consider this reaction:
Al2(SO4)3 (aq)+ BaCl3
(aq) Al2Cl6 (aq)- +
3BaSO4(s) . What is the...
asked 11 months ago -
Suppose that Savneet is considering increasing her
recent random sample from 20 car rentals to 40...
asked 11 months ago -
Trucks arrive at an unloading terminal at an average rate of 120
per hour.
Trucks arrive...
asked 11 months ago -
Why are methanol and ethanol completely soluble in water while
octanol is not very little soluble....
asked 11 months ago -
A facilities manager at a university reads in a research report
that the mean amount of...
asked 11 months ago -
When the CuSO4 is rehydrated by adding water to the anhydrous
compound, is this an endothermic...
asked 11 months ago -
A ray of sunlight is passing from diamond into crown glass; the
angle of incidence is...
asked 11 months ago -
A block of mass 0.249 kg is placed on top of a light, vertical
spring of...
asked 11 months ago -
how do the kidneys compensate in the presences of acidosis
a) trigger hyperventilate
b) reserve acid...
asked 11 months ago -
Question 501 pts
The rental rate of capital to the firm increases. Which of the
following...
asked 11 months ago