


Homework Answers

Add Answer to:
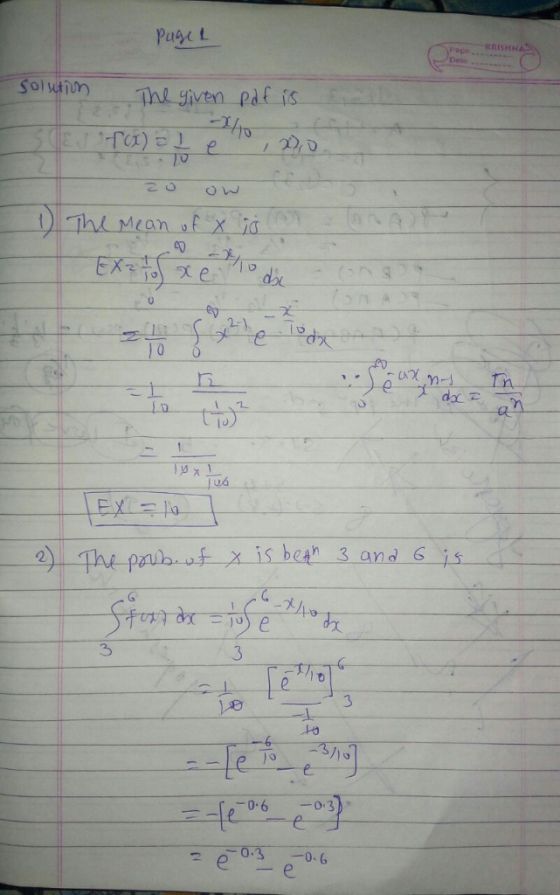
Exhibit 6-4 f(x)-(1/10) e-x/10 x 2 0 Refer to Exhibit 6-4. The mean of x is...
Exhibit 11.3 S $ $10 - - D 0 Units of a 100 Resource Refer to...
 Exhibit 11.3 S $ $10 - - D 0 Units of a 100 Resource Refer to Exhibit 11.3, which shows the demand and supply curves of a resource. The total resource earnings in equilibrium equal a. $300. O b. $400. C. $60. d. $40. O e. $1,000. 0= Icon Key Exhibit 15.2 MC AC 24 22 Price 00 14 MR 5 6 8 10 Quantity Refer to Exhibit 15.2, which shows the cost and revenue curves for a natural monopolist....
Question 2 Exhibit 4-5 Price (dollars) P. 0 QI Quantity Kidneys for Transplants Refer to Exhibit...
 Question 2 Exhibit 4-5 Price (dollars) P. 0 QI Quantity Kidneys for Transplants Refer to Exhibit 4-5. If a free market were allowed in the transplanted kidney market, then the equilibrium price would be Pg. The number of kidneys transplanted would increase by compared to the number transplanted at a price ceiling of P-50. Q-01) O (Q2-01) Question 3 Exhibit 3-10 30 20 Price of X (dollars) 10 100 300 Quantity of Refer to Exhibit 3-10, $20 is the price...
Exhibit 6-1 05.832 : Not Answered CPI Refer to Exhibit 6-1. Prices rose by approximately percent...
 Exhibit 6-1 05.832 : Not Answered CPI Refer to Exhibit 6-1. Prices rose by approximately percent from Year 1 to Year 5 106 b.9.6 6143 45 Exhibit 7-2 1990 2019 Goods Quantities 2019 Prices Quantities 10 papayas 1990 Prices $1.00 50.60 skirts $0.50 $0.80 $4.00 $4.00 Refer to Exhibit 7-2 GDP in 1990 is 2.551 Lb. 586. Limpossible to calculate without the CPL d. 592. e. $49.
Exhibit 1-3 Point X Y A 5 8 B 10 6 C 15 4 D 20...
Exhibit 1-3 Point X Y A 5 8 B 10 6 C 15 4 D 20 2 Refer to Exhibit 1-3. According to the data provided in this table, what is the slope of the line between points A and B, if these data were graphed with X on the horizontal axis and Y on the vertical axis? a) -0.40 b) -2.50 c) 0.40 d) 2.50 e) none of the above
If X has the distribution function 0 for x<1 for 1 〈 x < 4 F(x)-〉 for 4 〈 x < 6 for 6a < 10 1 for x 10 f...
 If X has the distribution function 0 for x<1 for 1 〈 x < 4 F(x)-〉 for 4 〈 x < 6 for 6a < 10 1 for x 10 find (a) P(2 〈 X 〈 6); (b) P(X= 4); (c) the probability mass function of X.
If X has the distribution function 0 for x
If X has the distribution function 0 for x<1 for 1 〈 x < 4 F(x)-〉 for 4 〈 x < 6 for 6a < 10 1 for x 10 find (a) P(2 〈 X 〈 6); (b) P(X= 4); (c) the probability mass function of X.
If X has the distribution function 0 for x
Exhibit 33-4 Country 1 Country 2 Good A Good B Good A Good B 250 0...
Exhibit 33-4 Country 1 Country 2 Good A Good B Good A Good B 250 0 75 0 200 10 60 15 150 20 45 30 100 30 30 45 50 40 15 60 0 50 0 75 Refer to Exhibit 33-4. The opportunity cost of one unit of good A is __________ for country 1 and __________ for country 2. A. 20B; 15B B. 0.2B; 1B C. 0.5B; 15B D. 5B; 1B E. 40B; 15B Refer to Exhibit 33-4....
Exhibit 6-1 Consider the continuous random variable x, which has a uniform distribution over the interval...
 Exhibit 6-1 Consider the continuous random variable x, which has a uniform distribution over the interval from 20 to 28. Refer to Exhibit 6-1. The probability density function has what value Select one: O a in the interval between 20 and 28? 1.000 O b. C. 0.125 d. 0.050 Exhibit 6-1 Consider the continuous random variable x, which has a uniform distribution over ase interval from 20 to 28 Refer to Exhibit 6-1. The probability that x will take on...
Exhibit 27-5 Units of Quantity of Output Marginal Revenue Labor 0 0 $6 1 100 6...
 Exhibit 27-5 Units of Quantity of Output Marginal Revenue Labor 0 0 $6 1 100 6 2 180 6 زر 250 6 4 310 6 5 330 6 Refer to Exhibit 27-5. Marginal physical product of the fourth unit of labor equals 60. equals 40. equals 24. equals 310. cannot be determined.
Refer to Exhibit 2-6. Which graph depicts a discovery of a new cheap source of energy...
 Refer to Exhibit 2-6. Which graph depicts a discovery of a new
cheap source of energy that assists in the production of both good
X and good Y?
Question 22 2 pts Exhibit 2-6 КАТА хо хо (2) (3) Refer to Exhibit 2-6. Which graph depicts a discovery of a new cheap source of energy that assists in the production of both good X and good Y? (2) О (4) О (1) (3)
Refer to Exhibit 2-6. Which graph depicts a discovery of a new
cheap source of energy that assists in the production of both good
X and good Y?
Question 22 2 pts Exhibit 2-6 КАТА хо хо (2) (3) Refer to Exhibit 2-6. Which graph depicts a discovery of a new cheap source of energy that assists in the production of both good X and good Y? (2) О (4) О (1) (3)
Question 14 4 pts Exhibit 4-8 24 6 3 :5 Quantity 01 02 Q Refer to...
 Question 14 4 pts Exhibit 4-8 24 6 3 :5 Quantity 01 02 Q Refer to Exhibit 4-8. If the wheat market is in competitive equilibrium the producers' surplus will equal O area 3+5 O area 6 O area 1+2+3+4+5 area 1+2+3 O area 1+2+4 Previous Next ʼ
 Exhibit 11.3 S $ $10 - - D 0 Units of a 100 Resource Refer to Exhibit 11.3, which shows the demand and supply curves of a resource. The total resource earnings in equilibrium equal a. $300. O b. $400. C. $60. d. $40. O e. $1,000. 0= Icon Key Exhibit 15.2 MC AC 24 22 Price 00 14 MR 5 6 8 10 Quantity Refer to Exhibit 15.2, which shows the cost and revenue curves for a natural monopolist....
 Question 2 Exhibit 4-5 Price (dollars) P. 0 QI Quantity Kidneys for Transplants Refer to Exhibit 4-5. If a free market were allowed in the transplanted kidney market, then the equilibrium price would be Pg. The number of kidneys transplanted would increase by compared to the number transplanted at a price ceiling of P-50. Q-01) O (Q2-01) Question 3 Exhibit 3-10 30 20 Price of X (dollars) 10 100 300 Quantity of Refer to Exhibit 3-10, $20 is the price...
 Exhibit 6-1 05.832 : Not Answered CPI Refer to Exhibit 6-1. Prices rose by approximately percent from Year 1 to Year 5 106 b.9.6 6143 45 Exhibit 7-2 1990 2019 Goods Quantities 2019 Prices Quantities 10 papayas 1990 Prices $1.00 50.60 skirts $0.50 $0.80 $4.00 $4.00 Refer to Exhibit 7-2 GDP in 1990 is 2.551 Lb. 586. Limpossible to calculate without the CPL d. 592. e. $49.
 If X has the distribution function 0 for x<1 for 1 〈 x < 4 F(x)-〉 for 4 〈 x < 6 for 6a < 10 1 for x 10 find (a) P(2 〈 X 〈 6); (b) P(X= 4); (c) the probability mass function of X.
If X has the distribution function 0 for x
If X has the distribution function 0 for x<1 for 1 〈 x < 4 F(x)-〉 for 4 〈 x < 6 for 6a < 10 1 for x 10 find (a) P(2 〈 X 〈 6); (b) P(X= 4); (c) the probability mass function of X.
If X has the distribution function 0 for x
 Exhibit 6-1 Consider the continuous random variable x, which has a uniform distribution over the interval from 20 to 28. Refer to Exhibit 6-1. The probability density function has what value Select one: O a in the interval between 20 and 28? 1.000 O b. C. 0.125 d. 0.050 Exhibit 6-1 Consider the continuous random variable x, which has a uniform distribution over ase interval from 20 to 28 Refer to Exhibit 6-1. The probability that x will take on...
 Exhibit 27-5 Units of Quantity of Output Marginal Revenue Labor 0 0 $6 1 100 6 2 180 6 زر 250 6 4 310 6 5 330 6 Refer to Exhibit 27-5. Marginal physical product of the fourth unit of labor equals 60. equals 40. equals 24. equals 310. cannot be determined.
 Refer to Exhibit 2-6. Which graph depicts a discovery of a new
cheap source of energy that assists in the production of both good
X and good Y?
Question 22 2 pts Exhibit 2-6 КАТА хо хо (2) (3) Refer to Exhibit 2-6. Which graph depicts a discovery of a new cheap source of energy that assists in the production of both good X and good Y? (2) О (4) О (1) (3)
Refer to Exhibit 2-6. Which graph depicts a discovery of a new
cheap source of energy that assists in the production of both good
X and good Y?
Question 22 2 pts Exhibit 2-6 КАТА хо хо (2) (3) Refer to Exhibit 2-6. Which graph depicts a discovery of a new cheap source of energy that assists in the production of both good X and good Y? (2) О (4) О (1) (3)
 Question 14 4 pts Exhibit 4-8 24 6 3 :5 Quantity 01 02 Q Refer to Exhibit 4-8. If the wheat market is in competitive equilibrium the producers' surplus will equal O area 3+5 O area 6 O area 1+2+3+4+5 area 1+2+3 O area 1+2+4 Previous Next ʼ
Most questions answered within 3 hours.
-
Where is the error in this code sequence?
String s1 = "Hello";
String s2 = "ello";...
asked 11 months ago -
Financial data for Joel de Paris, Inc., for last year
follow:
Joel de Paris, Inc.
Balance...
asked 11 months ago -
Consider this reaction:
Al2(SO4)3 (aq)+ BaCl3
(aq) Al2Cl6 (aq)- +
3BaSO4(s) . What is the...
asked 11 months ago -
Suppose that Savneet is considering increasing her
recent random sample from 20 car rentals to 40...
asked 11 months ago -
Trucks arrive at an unloading terminal at an average rate of 120
per hour.
Trucks arrive...
asked 11 months ago -
Why are methanol and ethanol completely soluble in water while
octanol is not very little soluble....
asked 11 months ago -
A facilities manager at a university reads in a research report
that the mean amount of...
asked 11 months ago -
When the CuSO4 is rehydrated by adding water to the anhydrous
compound, is this an endothermic...
asked 11 months ago -
A ray of sunlight is passing from diamond into crown glass; the
angle of incidence is...
asked 11 months ago -
A block of mass 0.249 kg is placed on top of a light, vertical
spring of...
asked 11 months ago -
how do the kidneys compensate in the presences of acidosis
a) trigger hyperventilate
b) reserve acid...
asked 11 months ago -
Question 501 pts
The rental rate of capital to the firm increases. Which of the
following...
asked 11 months ago