
Homework Answers

Add Answer to:
IIII. (11.92) Given the phase diagram of water in the figure p515. Label the regions. Predict...
Mole fraction of nonne, [6] Label the regions of the binary A,B phase diagram in the...
 Mole fraction of nonne, [6] Label the regions of the binary A,B phase diagram in the following figure. (a) Label each region with the state and chemical name of all substances presentif compounds give their formulas). (b) Label the figure with the melting points of each substance and eutectic point. Also label the composition of each eutectic point. Temperature, T LLLL 0 0.2 0.4 0.6 0.8 1
Among other things, phase diagrams help us predict those conditions under which a substance will exist...
 Among other things, phase diagrams help us predict those
conditions under which a substance will exist as a supercritical
fluid. Supercritical CO2 is especially useful as it is very
effective at dissolving nonpolar oils which constitute many of the
flavouring or odor-causing compounds in foods. For example, food
companies use supercritical CO2 to extract caffeine from
coffee.
a) Use the following data to label the following points on the
phase diagram for CO2: Triple point -57°C, 5.1 atm, Normal
sublimation...
Among other things, phase diagrams help us predict those
conditions under which a substance will exist as a supercritical
fluid. Supercritical CO2 is especially useful as it is very
effective at dissolving nonpolar oils which constitute many of the
flavouring or odor-causing compounds in foods. For example, food
companies use supercritical CO2 to extract caffeine from
coffee.
a) Use the following data to label the following points on the
phase diagram for CO2: Triple point -57°C, 5.1 atm, Normal
sublimation...
3. On Silver-Copper phase diagram, label the liquidus line, eutectic point, and all unlabeled regions. Also...
 3. On Silver-Copper phase diagram, label the liquidus line, eutectic point, and all unlabeled regions. Also answer questions below a. How many phases are there? b. What is the eutectic temperature? c. What is the eutectic concentration (in mass percent)? d. What is the composition of the Ag in the solid solution at the eutectic temperature? e. What is the composition of the Cu in the solid solution at the eutectic temperature? f. At 600°C what is the composition of...
46.2% Resources Give Up? Hint Consider the phase diagram for carbon dioxide. 73.0 In what phase...
 46.2% Resources Give Up? Hint Consider the phase diagram for carbon dioxide. 73.0 In what phase is CO, at 4 atm and -10 °C? solid liquid O gas Pressure (atm) solid liquid 5.11 1.0 31.1 -78.5-564 Temperature (°C) Starting from the same point, 4 atm and -10 °C, what phase change would eventually result from an increase in pressure? freezing deposition melting condensation sublimation vaporization
2. For the CA phase diagram, answer the following Label the figure and add is part...
 2. For the CA phase diagram, answer the following Label the figure and add is part of your answer sheet a) What is the cutectie temperature and compositi? (point) b) In the context of this diagram, what does the symbol report pasi c) Assume slow cooling and that equilibrium conditions exist for the alley face this is being cooled from 1000" when will the first solid form and what composite would the solid have points) 1) At the same composition...
Draw a phase diagram(and label all parts completely) that is consistent with the following information: 1....
 Draw a phase diagram(and label all parts completely) that is consistent with the following information: 1. Pressure is in mm Hg 2. Temperature is in °C 3. Liquid phase is denser than the solid phase 4. Has one triple point, which is located at 400 mm Hg and 70°C 5. Point A is located at 760 mm Hg and 35°C and is found on the equilibrium line between solid and liquid phases 6. Point B is located at 760 mm...
Take into account the phase diagram for the substance Z and state which statement is false....
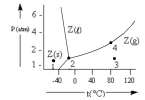 Take into account the phase diagram for the substance Z and state which statement is false.
Choose one:
a. If we are at point 4 and lower the temperature to 30 ° C, Z will evaporate
b. If we are at point 2 and then reduce the pressure, more of the evaporates of Z
c. At point 3, Z appears exclusively in gaseous form
d. If we are at point 1 and raise the temperature to -20 ° C, dry...
Take into account the phase diagram for the substance Z and state which statement is false.
Choose one:
a. If we are at point 4 and lower the temperature to 30 ° C, Z will evaporate
b. If we are at point 2 and then reduce the pressure, more of the evaporates of Z
c. At point 3, Z appears exclusively in gaseous form
d. If we are at point 1 and raise the temperature to -20 ° C, dry...
For the Cu-Ag phase diagram, answer the following. Label the figure and add is part of...
 For the Cu-Ag phase diagram, answer the following. Label the
figure and add is part of your answer sheet………………………….(11 points)
What is the eutectic temperature and composition? (1
point)
In the context of this diagram, what does the symbol β
represent? (1 point)
Assume slow cooling and that equilibrium conditions exist for
the alloy for 70 wt% Ag – 30 wt% Cu. If this is being cooled from
1000 °C, when will the first solid form and what composition would...
For the Cu-Ag phase diagram, answer the following. Label the
figure and add is part of your answer sheet………………………….(11 points)
What is the eutectic temperature and composition? (1
point)
In the context of this diagram, what does the symbol β
represent? (1 point)
Assume slow cooling and that equilibrium conditions exist for
the alloy for 70 wt% Ag – 30 wt% Cu. If this is being cooled from
1000 °C, when will the first solid form and what composition would...
For the Cu-Ag phase diagram, answer the following. Label the figure and add is part of...
 For the Cu-Ag phase diagram, answer the following. Label the figure and add is part of your answer sheet........ ...(11 points) a) What is the eutectic temperature and composition? (1 point) b) In the context of this diagram, what does the symbol B represent? (1 point) c) Assume slow cooling and that equilibrium conditions exist for the alloy for 70 wt% Ag – 30 wt% Cu. If this is being cooled from 1000 °C, when will the first solid form...
QUESTION 1 Given doubling number and limits predict growth curve. Label all phases of the growth...
 QUESTION 1 Given doubling number and limits predict growth curve. Label all phases of the growth curve Athrough D. State what the X and Y labels should be. The bacteria culture has a 2.3-hour doubling time. Starting concentration is 3.3x10^3 cells/ml. There has been 20 generation since the start of growth. Give an approximate time when the culture will reach the stationary phase taking into account all phases of the growth curve. (Calculation Spt, Graph with labels 5 pt)
 Mole fraction of nonne, [6] Label the regions of the binary A,B phase diagram in the following figure. (a) Label each region with the state and chemical name of all substances presentif compounds give their formulas). (b) Label the figure with the melting points of each substance and eutectic point. Also label the composition of each eutectic point. Temperature, T LLLL 0 0.2 0.4 0.6 0.8 1
 Among other things, phase diagrams help us predict those
conditions under which a substance will exist as a supercritical
fluid. Supercritical CO2 is especially useful as it is very
effective at dissolving nonpolar oils which constitute many of the
flavouring or odor-causing compounds in foods. For example, food
companies use supercritical CO2 to extract caffeine from
coffee.
a) Use the following data to label the following points on the
phase diagram for CO2: Triple point -57°C, 5.1 atm, Normal
sublimation...
Among other things, phase diagrams help us predict those
conditions under which a substance will exist as a supercritical
fluid. Supercritical CO2 is especially useful as it is very
effective at dissolving nonpolar oils which constitute many of the
flavouring or odor-causing compounds in foods. For example, food
companies use supercritical CO2 to extract caffeine from
coffee.
a) Use the following data to label the following points on the
phase diagram for CO2: Triple point -57°C, 5.1 atm, Normal
sublimation...
 3. On Silver-Copper phase diagram, label the liquidus line, eutectic point, and all unlabeled regions. Also answer questions below a. How many phases are there? b. What is the eutectic temperature? c. What is the eutectic concentration (in mass percent)? d. What is the composition of the Ag in the solid solution at the eutectic temperature? e. What is the composition of the Cu in the solid solution at the eutectic temperature? f. At 600°C what is the composition of...
 46.2% Resources Give Up? Hint Consider the phase diagram for carbon dioxide. 73.0 In what phase is CO, at 4 atm and -10 °C? solid liquid O gas Pressure (atm) solid liquid 5.11 1.0 31.1 -78.5-564 Temperature (°C) Starting from the same point, 4 atm and -10 °C, what phase change would eventually result from an increase in pressure? freezing deposition melting condensation sublimation vaporization
 2. For the CA phase diagram, answer the following Label the figure and add is part of your answer sheet a) What is the cutectie temperature and compositi? (point) b) In the context of this diagram, what does the symbol report pasi c) Assume slow cooling and that equilibrium conditions exist for the alley face this is being cooled from 1000" when will the first solid form and what composite would the solid have points) 1) At the same composition...
 Draw a phase diagram(and label all parts completely) that is consistent with the following information: 1. Pressure is in mm Hg 2. Temperature is in °C 3. Liquid phase is denser than the solid phase 4. Has one triple point, which is located at 400 mm Hg and 70°C 5. Point A is located at 760 mm Hg and 35°C and is found on the equilibrium line between solid and liquid phases 6. Point B is located at 760 mm...
 Take into account the phase diagram for the substance Z and state which statement is false.
Choose one:
a. If we are at point 4 and lower the temperature to 30 ° C, Z will evaporate
b. If we are at point 2 and then reduce the pressure, more of the evaporates of Z
c. At point 3, Z appears exclusively in gaseous form
d. If we are at point 1 and raise the temperature to -20 ° C, dry...
Take into account the phase diagram for the substance Z and state which statement is false.
Choose one:
a. If we are at point 4 and lower the temperature to 30 ° C, Z will evaporate
b. If we are at point 2 and then reduce the pressure, more of the evaporates of Z
c. At point 3, Z appears exclusively in gaseous form
d. If we are at point 1 and raise the temperature to -20 ° C, dry...
 For the Cu-Ag phase diagram, answer the following. Label the
figure and add is part of your answer sheet………………………….(11 points)
What is the eutectic temperature and composition? (1
point)
In the context of this diagram, what does the symbol β
represent? (1 point)
Assume slow cooling and that equilibrium conditions exist for
the alloy for 70 wt% Ag – 30 wt% Cu. If this is being cooled from
1000 °C, when will the first solid form and what composition would...
For the Cu-Ag phase diagram, answer the following. Label the
figure and add is part of your answer sheet………………………….(11 points)
What is the eutectic temperature and composition? (1
point)
In the context of this diagram, what does the symbol β
represent? (1 point)
Assume slow cooling and that equilibrium conditions exist for
the alloy for 70 wt% Ag – 30 wt% Cu. If this is being cooled from
1000 °C, when will the first solid form and what composition would...
 For the Cu-Ag phase diagram, answer the following. Label the figure and add is part of your answer sheet........ ...(11 points) a) What is the eutectic temperature and composition? (1 point) b) In the context of this diagram, what does the symbol B represent? (1 point) c) Assume slow cooling and that equilibrium conditions exist for the alloy for 70 wt% Ag – 30 wt% Cu. If this is being cooled from 1000 °C, when will the first solid form...
 QUESTION 1 Given doubling number and limits predict growth curve. Label all phases of the growth curve Athrough D. State what the X and Y labels should be. The bacteria culture has a 2.3-hour doubling time. Starting concentration is 3.3x10^3 cells/ml. There has been 20 generation since the start of growth. Give an approximate time when the culture will reach the stationary phase taking into account all phases of the growth curve. (Calculation Spt, Graph with labels 5 pt)
Most questions answered within 3 hours.
-
Where is the error in this code sequence?
String s1 = "Hello";
String s2 = "ello";...
asked 11 months ago -
Financial data for Joel de Paris, Inc., for last year
follow:
Joel de Paris, Inc.
Balance...
asked 11 months ago -
Consider this reaction:
Al2(SO4)3 (aq)+ BaCl3
(aq) Al2Cl6 (aq)- +
3BaSO4(s) . What is the...
asked 11 months ago -
Suppose that Savneet is considering increasing her
recent random sample from 20 car rentals to 40...
asked 11 months ago -
Trucks arrive at an unloading terminal at an average rate of 120
per hour.
Trucks arrive...
asked 11 months ago -
Why are methanol and ethanol completely soluble in water while
octanol is not very little soluble....
asked 11 months ago -
A facilities manager at a university reads in a research report
that the mean amount of...
asked 11 months ago -
When the CuSO4 is rehydrated by adding water to the anhydrous
compound, is this an endothermic...
asked 11 months ago -
A ray of sunlight is passing from diamond into crown glass; the
angle of incidence is...
asked 11 months ago -
A block of mass 0.249 kg is placed on top of a light, vertical
spring of...
asked 11 months ago -
how do the kidneys compensate in the presences of acidosis
a) trigger hyperventilate
b) reserve acid...
asked 11 months ago -
Question 501 pts
The rental rate of capital to the firm increases. Which of the
following...
asked 11 months ago