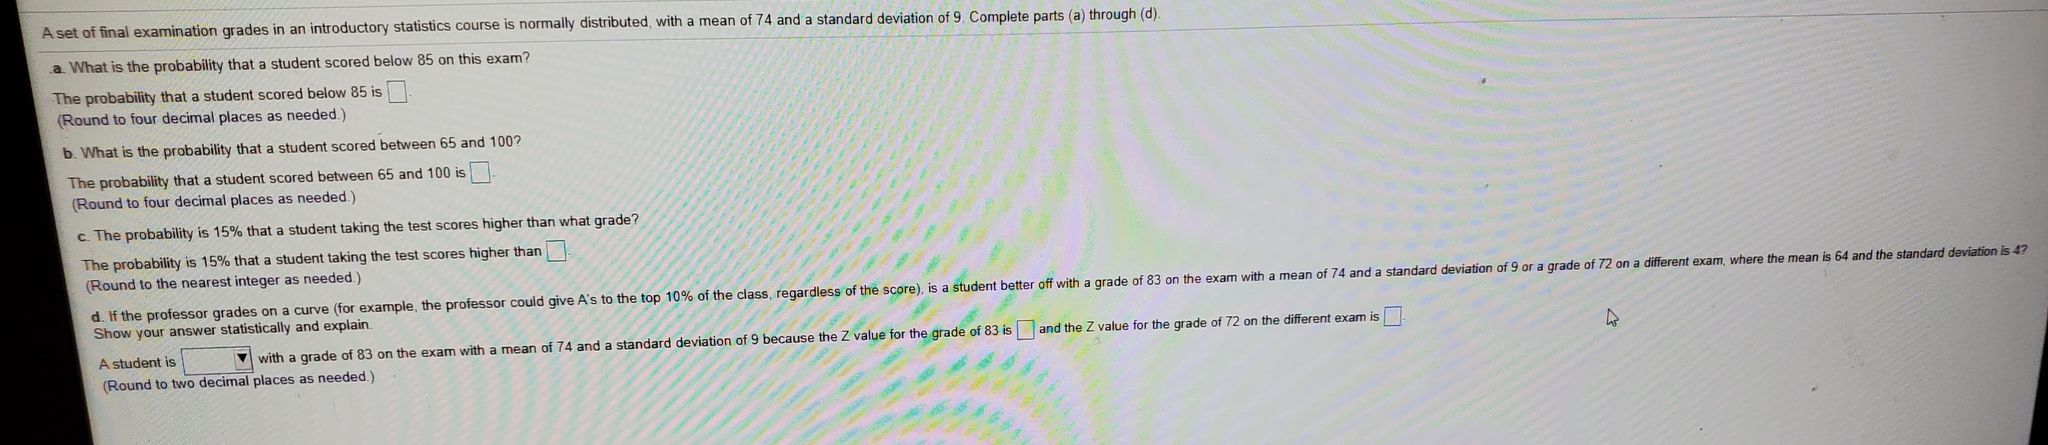
A set of final examination grades
Homework Answers
Request Answer!
We need at least 10 more requests to produce the answer.
0 / 10 have requested this problem solution
The more requests, the faster the answer.
A set of final examination grades in a calculus course wasfound to be normally distributed with...
A set of final examination grades in a calculus course wasfound to be normally distributed with a mean of 69 and a standarddeviation of 9. a. what is the probality of getting a grade of 91or less on this exam? b. What percentage of students scored between 65 and89? c. What percentage of students scored between 81 and89? d. Only 5% of the students taking the test scored higherthan what grade?
A set of final examination grades in an introductory statistics course is normally distributed, with a...
A set of final examination grades in an introductory statistics course is normally distributed, with a mean of 75 and a standard deviation of 8. Complete parts (a) through (d). a. What is the probability that a student scored below 88 on this exam? The probability that a student scored below 88 is 0.94790.9479. (Round to four decimal places as needed.) b. What is the probability that a student scored between 67 and 94? The probability that a student scored...
A set of final examination grades in an introductory statistics course is normally distributed, with a...
A set of final examination grades in an introductory statistics course is normally distributed, with a mean of 73 and a standard deviation of 7. Complete parts (a) through (d). a. What is the probability that a student scored below 86 on this exam? (Round to four decimal places as needed.) b. What is the probability that a student scored between 66 and 93? (Round to four decimal places as needed.) c. The probability is 55% that a student taking...
A set of final examination grades in a calculus course was found to be normally distributed...
A set of final examination grades in a calculus course was found to be normally distributed with a mean of 69 and a standard deviation of 8. Only 5% of the students taking the test scored higher than what grade? (Ch 6) answer is 83.81 but please show and explain how, what z table you used and the numbers. thanks
A set of final examination grades in an introductory statistics course is normally distributed, with a...
A set of final examination grades in an introductory statistics course is normally distributed, with a mean of 78 and a standard deviation of 8. What is the probability that a student scored between 70 and 99? The probability that a student scored between 70 and 99 is =?
A set of final examination grades in an introductory statistics course is normally distributed, with a...
A set of final examination grades in an introductory statistics course is normally distributed, with a mean of 78 and a standard deviation of 8. The probability is 5% that a student taking the test scores higher than what grade? The probability is 5% that a student taking the test scores higher than = ? (Round to the nearest integer as needed.)
A set of final examination grades in an introductory statistics course was found to be normally...
A set of final examination grades in an introductory statistics course was found to be normally distributed with a mean of 73 and a standard deviation of 8. The probability is 60% that a student taking the test scores higher than what grade?
A set of final examination grades ina STAT course was found to be normally distributed with a mean of 72 and standard deviation of 8

The following scores represent the final examination grades for an elementary statistics course:
The following scores represent the final examination grades for an elementary statistics course: 23 60 79 32 57 74 52 70 82 36 80 77 81 95 41 65 92 85 55 76 52 10 64 75 78 25 80 98 81 67 41 71 83 54 64 72 88 62 74 43 60 78 89 76 84 48 84 90 15 79 34 67 17 82 69 74 63 80 85 61 Calculate: Stem and leaf Relative frequency histogram Cumulative frequency Sample Mean Sample Median Mode Variance Standard deviation
02 The following scores represent the final examination grades for an elementary statistics course: 23 60...
 02 The following scores represent the final examination grades for an elementary statistics course: 23 60 79 32 57 74 52 70 82 36 80 77 81 95 41 65 92 85 55 76 52 10 64 75 78 25 80 98 81 67 41 71 83 54 64 72 88 62 74 43 60 78 89 76 84 48 84 90 15 79 34 67 17 82 69 74 63 80 85 61 Calculate: . Stem and leaf ....
 02 The following scores represent the final examination grades for an elementary statistics course: 23 60 79 32 57 74 52 70 82 36 80 77 81 95 41 65 92 85 55 76 52 10 64 75 78 25 80 98 81 67 41 71 83 54 64 72 88 62 74 43 60 78 89 76 84 48 84 90 15 79 34 67 17 82 69 74 63 80 85 61 Calculate: . Stem and leaf ....
Most questions answered within 3 hours.
-
Where is the error in this code sequence?
String s1 = "Hello";
String s2 = "ello";...
asked 10 months ago -
Financial data for Joel de Paris, Inc., for last year
follow:
Joel de Paris, Inc.
Balance...
asked 10 months ago -
Consider this reaction:
Al2(SO4)3 (aq)+ BaCl3
(aq) Al2Cl6 (aq)- +
3BaSO4(s) . What is the...
asked 10 months ago -
Suppose that Savneet is considering increasing her
recent random sample from 20 car rentals to 40...
asked 10 months ago -
Trucks arrive at an unloading terminal at an average rate of 120
per hour.
Trucks arrive...
asked 10 months ago -
Why are methanol and ethanol completely soluble in water while
octanol is not very little soluble....
asked 10 months ago -
A facilities manager at a university reads in a research report
that the mean amount of...
asked 10 months ago -
When the CuSO4 is rehydrated by adding water to the anhydrous
compound, is this an endothermic...
asked 10 months ago -
A ray of sunlight is passing from diamond into crown glass; the
angle of incidence is...
asked 10 months ago -
A block of mass 0.249 kg is placed on top of a light, vertical
spring of...
asked 10 months ago -
how do the kidneys compensate in the presences of acidosis
a) trigger hyperventilate
b) reserve acid...
asked 10 months ago -
Question 501 pts
The rental rate of capital to the firm increases. Which of the
following...
asked 10 months ago