
Homework Answers
1)
Independent variable: Profit
Dependent variable: Number of Endorsements
2)
To see whether the linear relationship exists between the independent and the dependent variable, the scatterplot is obtained in excel. The screenshot is shown below,

From the scatterplot we can observe the two variables are linearly associated hence the linear regression can be used here.
3)
Answer:
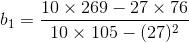
Slope = 1.9875
Explanation:
The regression equation is defined as,

where b0 = intercept and b1 = slope of the best fit line.
The least-square estimate of the slope is obtained using the following formula,

From the data values,
| X | Y | X^2 | Y^2 | X*Y |
| 0 | 2 | 0 | 4 | 0 |
| 3 | 8 | 9 | 64 | 24 |
| 2 | 7 | 4 | 49 | 14 |
| 1 | 3 | 1 | 9 | 3 |
| 5 | 13 | 25 | 169 | 65 |
| 5 | 12 | 25 | 144 | 60 |
| 4 | 9 | 16 | 81 | 36 |
| 3 | 9 | 9 | 81 | 27 |
| 0 | 3 | 0 | 9 | 0 |
| 4 | 10 | 16 | 100 | 40 |
| Sum = 27 | 76 | 105 | 710 | 269 |

4)
Answer:
Slope = 2.2336
The expected profit is approximately $ 2.2336 million when the number of endorsements is zero.
Explanation:
The least-square estimate of the slope is obtained using the following formula,

From the data values,
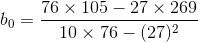

The intercept value gives the expected value of the dependent variable the independent variable = 0 hence the expected profit is approximately $ 2.2336 million when the number of endorsements is zero.
5)
Answer:
linear correlation coefficient = 0.9786
Explanation:
The linear correlation coefficient is obtained using the following formula,

From the data values,
![r=\frac{10\times 269-27\times 76}{\sqrt{[10\times 105-(27)^2][10\times 710-(76)^2]}}](http://img.homeworklib.com/questions/f7b51cd0-43da-11eb-a4a4-add7538b53be.png?x-oss-process=image/resize,w_560)

6)
The hypothesis test for significance of the correlation coefficient is performed in the following steps,
Hypotheses


Let the significance level, 
Test statistic
The t statistic is obtained using the formula,


P-value
The p-value for the t statistic = 13.4652 is obtained from the t distribution table for the degree of freedom = n-2=8
P-value = 0.0000
Conclusion
Since the p-value = 0.0000 is less than 0.05 at a 5% significance level, the null hypothesis is rejected hence there is sufficient evidence to conclude that the Profit and the number of endorsements are linearly correlated.
7)
Answer:
Expected profit = $ 14.1589 million
Explanation:
The regression equation is defined as,

For X = 6

8)
Answer:
Residual = $ 0.7913 million
Explanation:
The regression equation is defined as,
For X = 2

From the data values, the actual value of profit for the number of endorsement, X = 2 is 7

Add Answer to:
for this question, could you include written work of the
1) independant and dependant variables?
2)...
QUESTION 2 Following scatter plot represents a sample of paired X and Y values. Which of...
 QUESTION 2 Following scatter plot represents a sample of paired X and Y values. Which of the listed values of the linear correlation coefficient r is most likely to represent the given scater plor? r= -0.711 r= 0.667 r= 0.099 r= -0.018 and submit. Click SSare All Anscers to suce all ansers 13 14 Find the 99% confidence interval for the mean time it takes for conducting a job interview for a position of a retail associate in a supermarket...
Question 9 (1 point) You work for a company in the marketing department. Your manager has...
 Question 9 (1 point) You work for a company in the marketing department. Your manager has tasked you with forecasting sales by month for the next year. You notice that over the past 12 months sales have consistently gone up in a linear fashion, so you decide to run a regression the company's sales history. You find that the regression equation for the data is (sales) 104.21*(time) + 113.38. In 11 months you see the actual sales quantity was 380.64....
Please show instructions on how you got the answer. Thank you. Question 1: Question 2: Given...
 Please show instructions on how you got the answer. Thank
you.
Question 1:
Question 2:
Given are five observations for two variables, x and y. 1 2 3 4 (a) Develop a scatter diagram for these data. (b) What does the scatter diagram developed in part (a) indicate about the relationship between the two variables? There appears to be a negative linear relationship between x and y. There appears to be a positive linear relationship between x and y. There...
Please show instructions on how you got the answer. Thank
you.
Question 1:
Question 2:
Given are five observations for two variables, x and y. 1 2 3 4 (a) Develop a scatter diagram for these data. (b) What does the scatter diagram developed in part (a) indicate about the relationship between the two variables? There appears to be a negative linear relationship between x and y. There appears to be a positive linear relationship between x and y. There...
Question 1 Which of the following choices best describes the scatterplot shown below? Group of answer...
Question 1 Which of the following choices best describes the scatterplot shown below? Group of answer choices Linear, negative, strong No form, weak Linear, positive, strong Curved, weak Question 2 Which of the following choices is most likely to be the correlation of the data in the scatterplot shown below? Group of answer choices -0.14 1.04 0.86 -0.92 Question 3 Most roller coasters get their speed by dropping down a steep initial incline, so it makes sense that we can...
Application: 1) After reading the missing report and examining the evidence, which linear equation should be...
 Application: 1) After reading the missing report and examining the evidence, which linear equation should be used in order to predict the height of the victim? 2) Graph the linear equation that should be used to determine the height of the victim on the axis below. 4Y 200 180t 160 140 120 100 80 60 40 20 75 60 45 30 15 Bone Length (cm) Height (cm) Examine the evidence and compare the data to your graph. Do you think...
Question 1 (50 pts): Suppose that a client of yours measure the heights (in inches) of...
 Question 1 (50 pts): Suppose that a client of yours measure the heights (in inches) of n - 30 wheats grown at locations of various elevations (measured as meters above sea levels). Af- ter some discussion, you decided to fit a linear regression of wheat heights (denoted as yi) on the elevations of the locations (denoted as zi) as follows where ei, E2, . . . , En are i.i.d. errors with Elei] 0 and var(G) σ2. You calculated some...
Use SPSS for this exam, be sure to include all the following information to get full credits: (1) null and alternative hypotheses (15%) (2) nameofthe test(15%, explain why you chose it) (3) th...
 Use SPSS for this exam, be sure to include all the following information to get full credits: (1) null and alternative hypotheses (15%) (2) nameofthe test(15%, explain why you chose it) (3) thetest statistic and its degree offreedom or ANOVAtable(if applicable) (30%! (4) p-value (15%), and (5) scientific conclusion (25%, using 0.05 significance). 1. Ostriches live in hot environments, and they are normally exposed to the sun for long periods Mammals in similar environments have special mechanisms for reducing the...
[Marketing] Аавьса Norm: 2- AA EE _{Total 40 marks) Question 1 This question has two parts...
 [Marketing]
Аавьса Norm: 2- AA EE _{Total 40 marks) Question 1 This question has two parts - A and B. Answer BOTH parts. ABBEY is a company that specializes in making fashionable clothes for plus-sized people. A survey was performed for ABBEY, and a simple linear regression analysis was run on some of the data or interest in this analysis was the possible relationship between self- esteem (independent variable) and Intention to purchase ABBY clothes (dependent variable). They were measured...
[Marketing]
Аавьса Norm: 2- AA EE _{Total 40 marks) Question 1 This question has two parts - A and B. Answer BOTH parts. ABBEY is a company that specializes in making fashionable clothes for plus-sized people. A survey was performed for ABBEY, and a simple linear regression analysis was run on some of the data or interest in this analysis was the possible relationship between self- esteem (independent variable) and Intention to purchase ABBY clothes (dependent variable). They were measured...
Help with Question 2, do a CVP Analysis. Include an explanation on the side so that...
 Help with Question 2, do a CVP Analysis. Include an explanation on
the side so that I can understand what you did.
Fancy Millwork has a factory that produces custom kitchen cabinets. It has multiple product lines ment, we Materials and labor for the cabinets are determined by each job. To simplify the assign ill assume the following average costs e following information shows Fancy Millwork's cost structure of 2018. The materials include S2,000 for a custom kitchen. The hourly...
Help with Question 2, do a CVP Analysis. Include an explanation on
the side so that I can understand what you did.
Fancy Millwork has a factory that produces custom kitchen cabinets. It has multiple product lines ment, we Materials and labor for the cabinets are determined by each job. To simplify the assign ill assume the following average costs e following information shows Fancy Millwork's cost structure of 2018. The materials include S2,000 for a custom kitchen. The hourly...
question 1 question 2 question 3 Question Wildhorse Company had $273,300 of net income in 2019...
 question 1
question 2
question 3
Question Wildhorse Company had $273,300 of net income in 2019 when the selling price per unit was $155, the variable costs per unit were $90, and the fixed costs were $571,700. Management expects per unit data and total fixed costs to remain the same in 2020. The president of Wildhorse Company is under pressure from stockholders to increase net income by $39,000 in 2020, Compute the number of units sold in 2019. Compute the...
question 1
question 2
question 3
Question Wildhorse Company had $273,300 of net income in 2019 when the selling price per unit was $155, the variable costs per unit were $90, and the fixed costs were $571,700. Management expects per unit data and total fixed costs to remain the same in 2020. The president of Wildhorse Company is under pressure from stockholders to increase net income by $39,000 in 2020, Compute the number of units sold in 2019. Compute the...
 QUESTION 2 Following scatter plot represents a sample of paired X and Y values. Which of the listed values of the linear correlation coefficient r is most likely to represent the given scater plor? r= -0.711 r= 0.667 r= 0.099 r= -0.018 and submit. Click SSare All Anscers to suce all ansers 13 14 Find the 99% confidence interval for the mean time it takes for conducting a job interview for a position of a retail associate in a supermarket...
 Question 9 (1 point) You work for a company in the marketing department. Your manager has tasked you with forecasting sales by month for the next year. You notice that over the past 12 months sales have consistently gone up in a linear fashion, so you decide to run a regression the company's sales history. You find that the regression equation for the data is (sales) 104.21*(time) + 113.38. In 11 months you see the actual sales quantity was 380.64....
 Please show instructions on how you got the answer. Thank
you.
Question 1:
Question 2:
Given are five observations for two variables, x and y. 1 2 3 4 (a) Develop a scatter diagram for these data. (b) What does the scatter diagram developed in part (a) indicate about the relationship between the two variables? There appears to be a negative linear relationship between x and y. There appears to be a positive linear relationship between x and y. There...
Please show instructions on how you got the answer. Thank
you.
Question 1:
Question 2:
Given are five observations for two variables, x and y. 1 2 3 4 (a) Develop a scatter diagram for these data. (b) What does the scatter diagram developed in part (a) indicate about the relationship between the two variables? There appears to be a negative linear relationship between x and y. There appears to be a positive linear relationship between x and y. There...
 Application: 1) After reading the missing report and examining the evidence, which linear equation should be used in order to predict the height of the victim? 2) Graph the linear equation that should be used to determine the height of the victim on the axis below. 4Y 200 180t 160 140 120 100 80 60 40 20 75 60 45 30 15 Bone Length (cm) Height (cm) Examine the evidence and compare the data to your graph. Do you think...
 Question 1 (50 pts): Suppose that a client of yours measure the heights (in inches) of n - 30 wheats grown at locations of various elevations (measured as meters above sea levels). Af- ter some discussion, you decided to fit a linear regression of wheat heights (denoted as yi) on the elevations of the locations (denoted as zi) as follows where ei, E2, . . . , En are i.i.d. errors with Elei] 0 and var(G) σ2. You calculated some...
 Use SPSS for this exam, be sure to include all the following information to get full credits: (1) null and alternative hypotheses (15%) (2) nameofthe test(15%, explain why you chose it) (3) thetest statistic and its degree offreedom or ANOVAtable(if applicable) (30%! (4) p-value (15%), and (5) scientific conclusion (25%, using 0.05 significance). 1. Ostriches live in hot environments, and they are normally exposed to the sun for long periods Mammals in similar environments have special mechanisms for reducing the...
 [Marketing]
Аавьса Norm: 2- AA EE _{Total 40 marks) Question 1 This question has two parts - A and B. Answer BOTH parts. ABBEY is a company that specializes in making fashionable clothes for plus-sized people. A survey was performed for ABBEY, and a simple linear regression analysis was run on some of the data or interest in this analysis was the possible relationship between self- esteem (independent variable) and Intention to purchase ABBY clothes (dependent variable). They were measured...
[Marketing]
Аавьса Norm: 2- AA EE _{Total 40 marks) Question 1 This question has two parts - A and B. Answer BOTH parts. ABBEY is a company that specializes in making fashionable clothes for plus-sized people. A survey was performed for ABBEY, and a simple linear regression analysis was run on some of the data or interest in this analysis was the possible relationship between self- esteem (independent variable) and Intention to purchase ABBY clothes (dependent variable). They were measured...
 Help with Question 2, do a CVP Analysis. Include an explanation on
the side so that I can understand what you did.
Fancy Millwork has a factory that produces custom kitchen cabinets. It has multiple product lines ment, we Materials and labor for the cabinets are determined by each job. To simplify the assign ill assume the following average costs e following information shows Fancy Millwork's cost structure of 2018. The materials include S2,000 for a custom kitchen. The hourly...
Help with Question 2, do a CVP Analysis. Include an explanation on
the side so that I can understand what you did.
Fancy Millwork has a factory that produces custom kitchen cabinets. It has multiple product lines ment, we Materials and labor for the cabinets are determined by each job. To simplify the assign ill assume the following average costs e following information shows Fancy Millwork's cost structure of 2018. The materials include S2,000 for a custom kitchen. The hourly...
 question 1
question 2
question 3
Question Wildhorse Company had $273,300 of net income in 2019 when the selling price per unit was $155, the variable costs per unit were $90, and the fixed costs were $571,700. Management expects per unit data and total fixed costs to remain the same in 2020. The president of Wildhorse Company is under pressure from stockholders to increase net income by $39,000 in 2020, Compute the number of units sold in 2019. Compute the...
question 1
question 2
question 3
Question Wildhorse Company had $273,300 of net income in 2019 when the selling price per unit was $155, the variable costs per unit were $90, and the fixed costs were $571,700. Management expects per unit data and total fixed costs to remain the same in 2020. The president of Wildhorse Company is under pressure from stockholders to increase net income by $39,000 in 2020, Compute the number of units sold in 2019. Compute the...
Most questions answered within 3 hours.
-
Where is the error in this code sequence?
String s1 = "Hello";
String s2 = "ello";...
asked 10 months ago -
Financial data for Joel de Paris, Inc., for last year
follow:
Joel de Paris, Inc.
Balance...
asked 10 months ago -
Consider this reaction:
Al2(SO4)3 (aq)+ BaCl3
(aq) Al2Cl6 (aq)- +
3BaSO4(s) . What is the...
asked 10 months ago -
Suppose that Savneet is considering increasing her
recent random sample from 20 car rentals to 40...
asked 10 months ago -
Trucks arrive at an unloading terminal at an average rate of 120
per hour.
Trucks arrive...
asked 10 months ago -
Why are methanol and ethanol completely soluble in water while
octanol is not very little soluble....
asked 10 months ago -
A facilities manager at a university reads in a research report
that the mean amount of...
asked 10 months ago -
When the CuSO4 is rehydrated by adding water to the anhydrous
compound, is this an endothermic...
asked 10 months ago -
A ray of sunlight is passing from diamond into crown glass; the
angle of incidence is...
asked 10 months ago -
A block of mass 0.249 kg is placed on top of a light, vertical
spring of...
asked 10 months ago -
how do the kidneys compensate in the presences of acidosis
a) trigger hyperventilate
b) reserve acid...
asked 10 months ago -
Question 501 pts
The rental rate of capital to the firm increases. Which of the
following...
asked 10 months ago