please answer with showing the work with excel
functions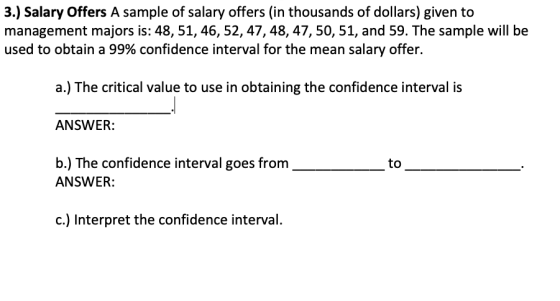
Homework Answers
Answer)
Excel function to find margin of error is
CONFIDENCE.T( alpha, standard_dev, size )
So, first we need to find the mean and s.d of the given data
Mean = (sum of the observations)/number of observations
Mean = (48 + 51....)/10 = 49.9
To find s.d first we need to subtract mean from each and every observation and then we need to take the square and finally add them
(48-49.9)^2 + (51-49.9)^2...
= 128.9
S.d = √{128.9/(10-1)} = 3.7845
Degrees of freedom is = n-1 = 9
For 9 degrees of freedom and 99% confidence level, critical value t from t table is = 3.25
Margin of error (MOE) = t*s.d/√n = 3.25*3.7845/√10 = 3.889
Confidence interval is given by
(Mean - MOE, Mean + MOE)
(46.011, 53.789)
We are 99% confident that true population mean lies in this estimated interval
Throgh excel
Function for margin of error is
CONFIDENCE.T( alpha, standard_dev, size )
Alpha = 1- confidence level = 1 - 0.99 = 0.01
S.d = 3.7845
Size = 10
=CONFIDENCE.T( 0.01, 3.7845, 10 )
Answer would be 3.889
Then find the interval
(Mean - MOE, Mean + MOE)
Add Answer to:
please answer with showing the work with excel
functions
3.) Salary Offers A sample of salary...
3. A hospital administrator wished to study the relation between patient satisfaction (Y) and pat...
 solvel only E F G H
below is pat data
3. A hospital administrator wished to study the relation between patient satisfaction (Y) and patients age (Xi, in years), severity of illness (X2, an index) and anxiety level (X3, an index). The administrator randomly selected 23 patients and collected the data in pat, where larger values of Y, X2 and X3 are, respectively, associated with more satisfaction, increased severity of illness and more anxiety. The data is saved in Moodle2...
solvel only E F G H
below is pat data
3. A hospital administrator wished to study the relation between patient satisfaction (Y) and patients age (Xi, in years), severity of illness (X2, an index) and anxiety level (X3, an index). The administrator randomly selected 23 patients and collected the data in pat, where larger values of Y, X2 and X3 are, respectively, associated with more satisfaction, increased severity of illness and more anxiety. The data is saved in Moodle2...
Problem 1: Confidence Interval for Percentage of B’s. The data set “STAT 250 Final Exam Scores”...
Problem 1: Confidence Interval for Percentage of B’s. The data set “STAT 250 Final Exam Scores” contains a random sample of 269 STAT 250 students’ final exam scores (maximum of 80) collected over the past two years. Answer the following questions using this data set. a) What proportion of students in our sample earned B’s on the final exam? A letter grade of B is obtained with a score of between 64 and 71 inclusive. Hint: You can do this...
Please answer the two questions below: 1.) Determine the t-score for a 99% confidence interval for...
Please answer the two questions below: 1.) Determine the t-score for a 99% confidence interval for a population mean from a sample of size 17. P() = [three decimal accuracy] 2.) Create a 95% confidence interval for the data set below. 46 52 54 49 51 54 51 53 53 ( , ) [two decimal accuracy] [two decimal accuracy]
Frequency and Relative Frequency Distribution.
 1. Frequency and Relative Frequency Distribution. What is the shape of the distribution of your sample data? Which class best estimates the center of the distribution? Do you have any modes? Are there any outliers? Make a guess as to the shape of the population distribution from the above histogram.Use 2 decimal places for all values. Confidence interval Construction Validate the Assumptions/Conditions to construct a 95% Confidence interval. What is the symbol and value of the critical value for this interval? (You must interpolate.) Write the formula...
(b) Using the data provided, in Excel, find the sample average and the sample standard deviation....
(b) Using the data provided, in Excel, find the sample average and the sample standard deviation. Find the sample size, find the degrees of freedom, find the t-critical value. (c) Compute a 95% confidence interval for the population average. State your confidence interval in words, clearly stating the context, and also show the answer in the ...< µ < ... format. (d) Using Excel, given a production run of size N=200 and the sample size of n=30, compute the number...
48 57 Amy Bakery has four shops in different area in a city. Monthly sales (in...
 48 57 Amy Bakery has four shops in different area in a city. Monthly sales (in thousands of dollars) from a random of 24 months from each of the 4 shops given in Table 1. Table 1: Monthly sales (in thousands of dollars) North East South West 77 75 97 60 45 42 60 54 56 49 68 47 44 39 58 57 63 61 69 51 75 63 79 50 90 81 99 73 32 47 46 41 41...
Please answer using EXCEL functions Solve confidence intervals for proportion, proportion with correction factor, and standard...
Please answer using EXCEL functions Solve confidence intervals for proportion, proportion with correction factor, and standard deviation. Confidence interval for a population standard deviation A random sample of 15 headache relief pills shows a standard deviation of .8% in the concentration of the active ingredient. Find a 90% confidence interval for the population standard deviation for these pills. Assume that the underlying population distribution of the concentration of the active ingredient is normal. Note: given these small values, use...
Hello, please help me understand what to look for so that I use the right method...
 Hello, please help me understand what to look for so that I use
the right method on the TI 83 and the steps for TI 83.
Assume that we want to construct a confidence interval. Do one of the following, as appropriate: (a) find the critic value/2. (b) find the critical value Zu/2. or (c) state that neither the normal distribution nor the t distribution applies 40- 30 The confidence level is 99%, σ is not known, and the histogram...
Hello, please help me understand what to look for so that I use
the right method on the TI 83 and the steps for TI 83.
Assume that we want to construct a confidence interval. Do one of the following, as appropriate: (a) find the critic value/2. (b) find the critical value Zu/2. or (c) state that neither the normal distribution nor the t distribution applies 40- 30 The confidence level is 99%, σ is not known, and the histogram...
Sample Data Sample Data Hour Sample Taken Hour Sample Taken 1 4 5 X 1 3...
 Sample Data Sample Data Hour Sample Taken Hour Sample Taken 1 4 5 X 1 3 1 42 2 3 4 5 6 2 39 36 25 60 28 53 22 56 41 34 43 45 59 42 36 40 45 39 48 26 42 34 61 48 45 29 3 31 61 38 40 54 26 38 42 37 41 53 37 47 41 37 29 20 26 43 38 33 37 37 35 33 36 41 25 37...
R code and answer questions please A certain enzyme in the liver of fish is considered...
 R code and answer questions please
A certain enzyme in the liver of fish is considered an indicator of trace amounts of a dangerous pollutant that is difficult to detect by chemical methods. Enzyme activities of less than 50 units per gram of liver (fresh weight) are taken to indicate the presence of the pollutant. A random sample was taken from a local stream and the enzyme concentrations were as follows 48 43 51 42 50 42 44 45 56...
R code and answer questions please
A certain enzyme in the liver of fish is considered an indicator of trace amounts of a dangerous pollutant that is difficult to detect by chemical methods. Enzyme activities of less than 50 units per gram of liver (fresh weight) are taken to indicate the presence of the pollutant. A random sample was taken from a local stream and the enzyme concentrations were as follows 48 43 51 42 50 42 44 45 56...
 solvel only E F G H
below is pat data
3. A hospital administrator wished to study the relation between patient satisfaction (Y) and patients age (Xi, in years), severity of illness (X2, an index) and anxiety level (X3, an index). The administrator randomly selected 23 patients and collected the data in pat, where larger values of Y, X2 and X3 are, respectively, associated with more satisfaction, increased severity of illness and more anxiety. The data is saved in Moodle2...
solvel only E F G H
below is pat data
3. A hospital administrator wished to study the relation between patient satisfaction (Y) and patients age (Xi, in years), severity of illness (X2, an index) and anxiety level (X3, an index). The administrator randomly selected 23 patients and collected the data in pat, where larger values of Y, X2 and X3 are, respectively, associated with more satisfaction, increased severity of illness and more anxiety. The data is saved in Moodle2...
 48 57 Amy Bakery has four shops in different area in a city. Monthly sales (in thousands of dollars) from a random of 24 months from each of the 4 shops given in Table 1. Table 1: Monthly sales (in thousands of dollars) North East South West 77 75 97 60 45 42 60 54 56 49 68 47 44 39 58 57 63 61 69 51 75 63 79 50 90 81 99 73 32 47 46 41 41...
 Hello, please help me understand what to look for so that I use
the right method on the TI 83 and the steps for TI 83.
Assume that we want to construct a confidence interval. Do one of the following, as appropriate: (a) find the critic value/2. (b) find the critical value Zu/2. or (c) state that neither the normal distribution nor the t distribution applies 40- 30 The confidence level is 99%, σ is not known, and the histogram...
Hello, please help me understand what to look for so that I use
the right method on the TI 83 and the steps for TI 83.
Assume that we want to construct a confidence interval. Do one of the following, as appropriate: (a) find the critic value/2. (b) find the critical value Zu/2. or (c) state that neither the normal distribution nor the t distribution applies 40- 30 The confidence level is 99%, σ is not known, and the histogram...
 Sample Data Sample Data Hour Sample Taken Hour Sample Taken 1 4 5 X 1 3 1 42 2 3 4 5 6 2 39 36 25 60 28 53 22 56 41 34 43 45 59 42 36 40 45 39 48 26 42 34 61 48 45 29 3 31 61 38 40 54 26 38 42 37 41 53 37 47 41 37 29 20 26 43 38 33 37 37 35 33 36 41 25 37...
 R code and answer questions please
A certain enzyme in the liver of fish is considered an indicator of trace amounts of a dangerous pollutant that is difficult to detect by chemical methods. Enzyme activities of less than 50 units per gram of liver (fresh weight) are taken to indicate the presence of the pollutant. A random sample was taken from a local stream and the enzyme concentrations were as follows 48 43 51 42 50 42 44 45 56...
R code and answer questions please
A certain enzyme in the liver of fish is considered an indicator of trace amounts of a dangerous pollutant that is difficult to detect by chemical methods. Enzyme activities of less than 50 units per gram of liver (fresh weight) are taken to indicate the presence of the pollutant. A random sample was taken from a local stream and the enzyme concentrations were as follows 48 43 51 42 50 42 44 45 56...
Most questions answered within 3 hours.
-
Where is the error in this code sequence?
String s1 = "Hello";
String s2 = "ello";...
asked 10 months ago -
Financial data for Joel de Paris, Inc., for last year
follow:
Joel de Paris, Inc.
Balance...
asked 10 months ago -
Consider this reaction:
Al2(SO4)3 (aq)+ BaCl3
(aq) Al2Cl6 (aq)- +
3BaSO4(s) . What is the...
asked 10 months ago -
Suppose that Savneet is considering increasing her
recent random sample from 20 car rentals to 40...
asked 10 months ago -
Trucks arrive at an unloading terminal at an average rate of 120
per hour.
Trucks arrive...
asked 10 months ago -
Why are methanol and ethanol completely soluble in water while
octanol is not very little soluble....
asked 10 months ago -
A facilities manager at a university reads in a research report
that the mean amount of...
asked 10 months ago -
When the CuSO4 is rehydrated by adding water to the anhydrous
compound, is this an endothermic...
asked 10 months ago -
A ray of sunlight is passing from diamond into crown glass; the
angle of incidence is...
asked 10 months ago -
A block of mass 0.249 kg is placed on top of a light, vertical
spring of...
asked 10 months ago -
how do the kidneys compensate in the presences of acidosis
a) trigger hyperventilate
b) reserve acid...
asked 10 months ago -
Question 501 pts
The rental rate of capital to the firm increases. Which of the
following...
asked 10 months ago