
Homework Answers
Let write data in order
25 35 43 44 47 48 54 55 56 57
59 62 63 65 66 68 69 69 71 72
72 73 74 76 77 77 78 79 80 81
82 82 83 85 89 92 93 94 97 98
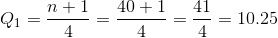
1st Quartile is given as..
10.25th Observation =10th Obs + 0.25( 11th Obs - 10th Obs )
10.25th Observation =57+0.25(59-57)= 57.5


30th Observation =30th Obs + 0.75( 31th Obs - 30th Obs )
10.25th Observation =81+0.75(82-81)= 81.75


Add Answer to:
The ages at death for a sample of 40 residents who died in certain city are...
Find the indicated measure. The test scores of 40 students are listed below. Find P85.
Find the indicated measure. The test scores of 40 students are listed below. Find P85. 30 35 43 44 47 48 54 55 56 57 59 62 63 65 66 68 69 69 71 72 72 73 74 76 77 77 78 79 80 81 81 82 83 85 89 92 93 94 97 98 1) 85 2) 87 3) 89 4) 34
Find the indicated measure. The test scores of 40 students are listed below. Find P85. 30...
 Find the indicated measure. The test scores of 40 students are listed below. Find P85. 30 35 43 44 47 48 54 55 56 57 59 62 63 65 66 68 69 69 71 72 72 73 74 76 77 77 78 79 80 81 81 82 83 85 89 92 93 94 97 98 1) 85 2) 87 3) 89 4) 34
Consider the below matrixA, which you can copy and paste directly into Matlab.
Problem #1: Consider the below matrix A, which you can copy and paste directly into Matlab. The matrix contains 3 columns. The first column consists of Test #1 marks, the second column is Test # 2 marks, and the third column is final exam marks for a large linear algebra course. Each row represents a particular student.A = [36 45 75 81 59 73 77 73 73 65 72 78 65 55 83 73 57 78 84 31 60 83...
Question 1 15 pts Test scores for a class of 40 students are listed below: 25...
 Question 1 15 pts Test scores for a class of 40 students are listed below: 25 35 43 44 47 48 54 55 56 57 59 62 63 65 66 68 69 69 71 72 72 73 74 76 77 77 78 79 80 81 81 82 83 85 89 92 93 94 97 98 a) The mean of the sample data is b) The median of the sample data is c) The standard deviation of the sample data is...
Use the Grouped Distribution method for the following exercise (see Self-Test 2-4 for detailed instructions), rounding...
Use the Grouped Distribution method for the following exercise (see Self-Test 2-4 for detailed instructions), rounding each answer to the nearest whole number. Using the frequency distribution below (scores on a statistics exam taken by 80 students), determine:ion 1 of the preliminary test (scores on a statistics exam taken by 80 students), determine: 68 84 75 82 68 90 62 88 76 93 73 79 88 73 60 93 71 59 85 75 61 65 75 87 74 62 95...
1. Forecast demand for Year 4. a. Explain what technique you utilized to forecast your demand....
 1. Forecast demand for Year 4.
a. Explain what technique you utilized to forecast your
demand.
b. Explain why you chose this technique over others.
Year 3 Year 1 Year 2 Actual Actual Actual Forecast Forecast Forecast Demand Demand Demand Week 1 52 57 63 55 66 77 Week 2 49 58 68 69 75 65 Week 3 47 50 58 65 80 74 Week 4 60 53 58 55 78 67 57 Week 5 49 57 64 76 77...
1. Forecast demand for Year 4.
a. Explain what technique you utilized to forecast your
demand.
b. Explain why you chose this technique over others.
Year 3 Year 1 Year 2 Actual Actual Actual Forecast Forecast Forecast Demand Demand Demand Week 1 52 57 63 55 66 77 Week 2 49 58 68 69 75 65 Week 3 47 50 58 65 80 74 Week 4 60 53 58 55 78 67 57 Week 5 49 57 64 76 77...
Use the accompanying data set on the pulse rates (in beats per minute) of males to...
Use the accompanying data set on the pulse rates (in beats per minute) of males to complete parts (a) and (b) below. LOADING... Click the icon to view the pulse rates of males. a. Find the mean and standard deviation, and verify that the pulse rates have a distribution that is roughly normal. The mean of the pulse rates is 71.871.8 beats per minute. (Round to one decimal place as needed.) The standard deviation of the pulse rates is 12.212.2...
Use this set of 40 exam scores as the POPULATION for this activity: (put them into...
Use this set of 40 exam scores as the POPULATION for this activity: (put them into List 1 in your calculator) 67 90 74 66 76 79 77 53 86 86 68 81 72 57 79 78 50 66 77 66 81 79 80 73 71 56 81 86 62 69 81 78 77 80 88 62 67 62 74 94 Use this set of 40 exam scores as the POPULATION for this activity: (put them into List 1 in...
1. Ages of Vice Presidents at the Time of Their Death. The ages at the time...
 1. Ages of Vice Presidents at the Time of Their Death. The ages at the time of death of those Vice Presidents of the United States who have passed away are listed below. Do the following: a. Use the data to construct a frequency distribution. Use 6 classes. b. Find the relative frequency for the frequency distribution. c. Construct a histogram, frequency polygon, and ogive for the data. d. Construct a histogram, frequency polygon, and ogive using relative frequencies for...
 Find the indicated measure. The test scores of 40 students are listed below. Find P85. 30 35 43 44 47 48 54 55 56 57 59 62 63 65 66 68 69 69 71 72 72 73 74 76 77 77 78 79 80 81 81 82 83 85 89 92 93 94 97 98 1) 85 2) 87 3) 89 4) 34
 Question 1 15 pts Test scores for a class of 40 students are listed below: 25 35 43 44 47 48 54 55 56 57 59 62 63 65 66 68 69 69 71 72 72 73 74 76 77 77 78 79 80 81 81 82 83 85 89 92 93 94 97 98 a) The mean of the sample data is b) The median of the sample data is c) The standard deviation of the sample data is...
 1. Forecast demand for Year 4.
a. Explain what technique you utilized to forecast your
demand.
b. Explain why you chose this technique over others.
Year 3 Year 1 Year 2 Actual Actual Actual Forecast Forecast Forecast Demand Demand Demand Week 1 52 57 63 55 66 77 Week 2 49 58 68 69 75 65 Week 3 47 50 58 65 80 74 Week 4 60 53 58 55 78 67 57 Week 5 49 57 64 76 77...
1. Forecast demand for Year 4.
a. Explain what technique you utilized to forecast your
demand.
b. Explain why you chose this technique over others.
Year 3 Year 1 Year 2 Actual Actual Actual Forecast Forecast Forecast Demand Demand Demand Week 1 52 57 63 55 66 77 Week 2 49 58 68 69 75 65 Week 3 47 50 58 65 80 74 Week 4 60 53 58 55 78 67 57 Week 5 49 57 64 76 77...
 1. Ages of Vice Presidents at the Time of Their Death. The ages at the time of death of those Vice Presidents of the United States who have passed away are listed below. Do the following: a. Use the data to construct a frequency distribution. Use 6 classes. b. Find the relative frequency for the frequency distribution. c. Construct a histogram, frequency polygon, and ogive for the data. d. Construct a histogram, frequency polygon, and ogive using relative frequencies for...
Most questions answered within 3 hours.
-
Where is the error in this code sequence?
String s1 = "Hello";
String s2 = "ello";...
asked 11 months ago -
Financial data for Joel de Paris, Inc., for last year
follow:
Joel de Paris, Inc.
Balance...
asked 11 months ago -
Consider this reaction:
Al2(SO4)3 (aq)+ BaCl3
(aq) Al2Cl6 (aq)- +
3BaSO4(s) . What is the...
asked 11 months ago -
Suppose that Savneet is considering increasing her
recent random sample from 20 car rentals to 40...
asked 11 months ago -
Trucks arrive at an unloading terminal at an average rate of 120
per hour.
Trucks arrive...
asked 11 months ago -
Why are methanol and ethanol completely soluble in water while
octanol is not very little soluble....
asked 11 months ago -
A facilities manager at a university reads in a research report
that the mean amount of...
asked 11 months ago -
When the CuSO4 is rehydrated by adding water to the anhydrous
compound, is this an endothermic...
asked 11 months ago -
A ray of sunlight is passing from diamond into crown glass; the
angle of incidence is...
asked 11 months ago -
A block of mass 0.249 kg is placed on top of a light, vertical
spring of...
asked 11 months ago -
how do the kidneys compensate in the presences of acidosis
a) trigger hyperventilate
b) reserve acid...
asked 11 months ago -
Question 501 pts
The rental rate of capital to the firm increases. Which of the
following...
asked 11 months ago