Please provide step by step spss instructions for numbers 5-10 To prepare for this Assignment, imagine...
Please provide step by step spss instructions for numbers 5-10
To prepare for this Assignment, imagine that you have information about how 20 nursing students and 20 psychology students felt about starting PSYC 3002 on Day 1 of this class. You want to know if nursing students and psychology students felt differently about embarking on the Introduction to Basic Statistics journey.
Data Set :
| Nursing | Psychology | |
| Nervous | 4 | 11 |
| Excited | 16 | 9 |
| Another way of looking at this data set would be: |
| 4 Nervous Nursing Students |
| 11 Nervous Psychology Students |
| 16 Excited Nursing Students |
| 9 Excited Psychology Students |
By Day 7
To complete this Assignment, submit your answers to the following. Use SPSS to determine if academic program is related to feelings about PSYC 3002 by computing the appropriate chi square test.
- Recall the four scales of measurement you learned about in Week 1 (i.e., nominal, ordinal, interval, ratio). Explain what scale of measurement is used to measure academic program in this example. How do you know?
- Explain what scale of measurement is used to measure feeling about PSYC 3002. Explain how you know.
- State whether this scenario requires a goodness of fit test or a test of independence. Explain your answer.
- Before computing the chi square, state the null hypothesis and alternative hypothesis in words (not formulas).
- Identify the obtained χ2 using SPSS and report it in your answer document.
- State the degrees of freedom and explain how you calculated it by hand.
- Identify the p value using SPSS and report it in your answer document.
- Explain whether you should retain or reject the null hypothesis and why.
- Are the results statistically significant? How do you know?
- Explain what you can determine about the relationship between academic program and feelings about PSYC 3002.
Homework Answers
Our objective, here, is to test the claim whether nursing students and psychology students felt differently about embarking on the Introduction to Basic Statistics journey. If this was not the case, we would expect equal no. of nursing and psychology students to feel nervous / excited.
We would have enough evidence to prove otherwise if the observed counts differ significantly from expected counts.
The test hypotheses are
H0: There is no significant dependence between Major (subject) chosen by students and their response on Basic statistics (Or) H0: Oi = Ei
Vs
Ha: There is a significant dependence between Major (subject) chosen by students and their response on Basic statistics (Or) Ha: Oi ≠ Ei
Using SPSS,


We get the Output:

Recall the four scales of measurement you learned about in Week 1 (i.e., nominal, ordinal, interval, ratio). Explain what scale of measurement is used to measure academic program in this example. How do you know?
The data can be entered in the form of 1's and 2's (representing the categories for the two variables) and then coding the values using value labels:


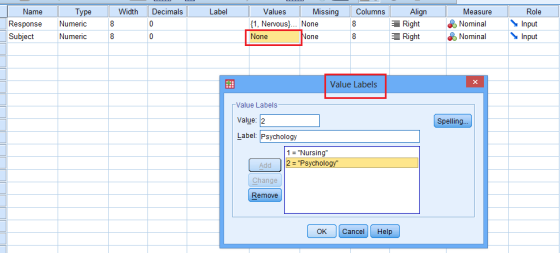
Clicking on the value label A - 1 in the tab, we get the labels in the data view.


Recalling the four scales of measurement (i.e., nominal, ordinal, interval, ratio), since, both the variables 'Academic Program' and 'Feeling' are both categorical in nature, they are measured in nominal scale with distinct categories.The scale of measurement used to measure academic program in this example is nominal, since the observations are nothing but counts of students who belong to either of its distinct categories- Nursing or Psychology.
Explain what scale of measurement is used to measure feeling about PSYC 3002. Explain how you know.
The scale of measurement used to measure feeling about PSYC 3002 is again nominal since the observations are nothing but counts of students who belong to each of its distinct category- Nervous or Excited.
State whether this scenario requires a goodness of fit test or a test of independence. Explain your answer.
This scenario requires a test of independence because our objective here, is to test if academic program is dependent on affects the measure of feeling about PSYC 3002.
Before computing the chi square, state the null hypothesis and alternative hypothesis in words (not formulas).
H0: There is no significant dependence between Academic Program chosen by students and their Feeling on Basic statistics (or) Academic Program chosen & Feeling on Basic statistics are independent.
Vs
Ha: There is a significant dependence between Academic Program chosen by students and their Feeling on Basic statistics (or) Academic Program chosen & Feeling on Basic statistics are dependent.
Identify the obtained χ2 using SPSS and report it in your answer document.
From the SPSS output obtained, the Pearson's chi square statistic has the value 5.227
State the degrees of freedom and explain how you calculated it by hand.
From the SPSS output obtained, the degrees of freedom, is 1. It can be obtained using the formula: (No. of Rows - 1)(No. of Colmns - 1) = (2-1)(2-1) = (1)(1) = 1 degree of freedom.
Identify the p value using SPSS and report it in your answer document.
The p value obtained is 0.022. It is the probability of obtaining a result as extreme as the one obtained, when the null hypothesis is true.
Explain whether you should retain or reject the null hypothesis and why.
Based on the p- value obtained above, since the chance of obtaining a result as extreme as the one obtained, when the null hypothesis is true is very low (0.022 < 0.05) at say, 5% level of significance; chance of the null hypothesis being true is low. We may reject H0 at 5% level.
Are the results statistically significant? How do you know?
We may conclude that the result is statistically significant. Since, the result deviates significantly from the null.
Explain what you can determine about the relationship between academic program and feelings about PSYC 3002.
Regarding the relationship between academic program and feelings about PSYC 3002, we may conclude that the two study variables are dependent. Based on this sample data, we may infer that nursing students and psychology students felt differently about embarking on the Introduction to Basic Statistics journey.
If you have any doubts please let me know in the comment section. Thank you.
Add Answer to:
Please provide step by step spss instructions for
numbers 5-10
To prepare for this Assignment, imagine...
imagine that you have information about how 20 nursing students and 20 psychology students felt about...
imagine that you have information about how 20 nursing students and 20 psychology students felt about starting PSYC 3002 on Day 1 of this class. You want to know if nursing students and psychology students felt differently about embarking on the Introduction to Basic Statistics journey. State the degrees of freedom and explain how you calculated it by hand. dat 5 Nervous Nursing Students 10 Nervous Psychology Students 15 Excited Nursing Students 10 Excited Psychology Students set
Psy 248: STATISTICS- MARIA MIRANDA Computer Lab Assignment II, SP 2019 Comparing means using t-te...
 Psy 248: STATISTICS- MARIA MIRANDA Computer Lab Assignment II, SP 2019 Comparing means using t-tests This assignment will give you practice choosing the appropriate test statistic to use for different research designs that all involve comparing using t-tests. You will need to enter the data, use SPSS to test hypothesis, and write a conclusion for each problem stating weather or not the samples differed significantly. To run all 3 tests, use: ANALYZE, COMPARE MEANS, and then select the type of...
Assignment #IS: Within Subjects ANOVA Instructions: For each research scenario, please complete t...
 please show all 6 steps with calculations
Assignment #IS: Within Subjects ANOVA Instructions: For each research scenario, please complete the source table and conduct a hypothesis test at α-.05 significance level using a within-subjects ANOVA to determine if one condition is different from the others. Please be sure to show your work when performing mathematical operations. Please round all source table calculations to two decimal places Scenario 1. Dr. Smith has developed a new way to administer a GRE prep...
please show all 6 steps with calculations
Assignment #IS: Within Subjects ANOVA Instructions: For each research scenario, please complete the source table and conduct a hypothesis test at α-.05 significance level using a within-subjects ANOVA to determine if one condition is different from the others. Please be sure to show your work when performing mathematical operations. Please round all source table calculations to two decimal places Scenario 1. Dr. Smith has developed a new way to administer a GRE prep...
Assignment # 1 3: Between-Subjects ANOVA Instructions: For each research scenario, please complet...
 please show all 6 steps with calculations!
Assignment # 1 3: Between-Subjects ANOVA Instructions: For each research scenario, please complete the source table and conduct a hypothesis test at a-05 significance level using a between-groups ANOVA to determine if one group is different from the others. Please be sure to show your work when performing mathematical operations. Please round all calculations to two decimal places. Scenario 1. Dr. Smith has developed a new way to administer a GRE prep workshop...
please show all 6 steps with calculations!
Assignment # 1 3: Between-Subjects ANOVA Instructions: For each research scenario, please complete the source table and conduct a hypothesis test at a-05 significance level using a between-groups ANOVA to determine if one group is different from the others. Please be sure to show your work when performing mathematical operations. Please round all calculations to two decimal places. Scenario 1. Dr. Smith has developed a new way to administer a GRE prep workshop...
Assignment #5: Analysis of Variance and Post Hoc Tests Directions: Using the information from the...
Assignment #5: Analysis of Variance and Post Hoc Tests Directions: Using the information from the following scenario, conduct a one-way ANOVA and specify the LSD post hoc test. The superintendent is continuing to examine the data that has been reported for the district. Another question concerned the differences in performance on high stakes tests. To examine this issue, the superintendent obtained the average scale scores for schools that participated in the high stakes testing for the district and two comparison...
Researchers studied the effects of learning about the effectiveness of a new medication (Tal & Wansink,...
 Researchers studied the effects of learning about the effectiveness of a new medication (Tal & Wansink, 2014). Some participants heard information about the medication; others heard the same information and saw a graph that depicted the data they had heard about. Thus, the two groups had identical information. Participants rated the effectiveness of the medication on a scale of 1-9, with 9 indicating a higher level of effectiveness. The researchers reported "Participants given graphs expressed greater belief in the claims,...
based on this assignment: For this assignment, you will undertake an analysis based on a self-designed...
based on this assignment: For this assignment, you will undertake an analysis based on a self-designed fictitious study that utilizes statistical methodologies. You will first develop a fictitious problem to examine - it can be anything. For example, maybe you want to look at whether scores on a standardized college placement test (like the SAT) are related to the level of income a person makes 10 years after college; Or, whether those who participate in a Leadership Training program rated...
please help with 4 & 6 3. For each of the following situations determine whether a...
 please help with 4 & 6
3. For each of the following situations determine whether a one- or a two-tailed test is appropriate. Also, state the research and the null hypotheses. a. You are interested in finding out if the average household income of residents in your state is different from the national average household. According to the U.S. Census, for 2014, the national average household income is $53,657.15 b. You believe that students in small liberal arts colleges attend...
please help with 4 & 6
3. For each of the following situations determine whether a one- or a two-tailed test is appropriate. Also, state the research and the null hypotheses. a. You are interested in finding out if the average household income of residents in your state is different from the national average household. According to the U.S. Census, for 2014, the national average household income is $53,657.15 b. You believe that students in small liberal arts colleges attend...
 Psy 248: STATISTICS- MARIA MIRANDA Computer Lab Assignment II, SP 2019 Comparing means using t-tests This assignment will give you practice choosing the appropriate test statistic to use for different research designs that all involve comparing using t-tests. You will need to enter the data, use SPSS to test hypothesis, and write a conclusion for each problem stating weather or not the samples differed significantly. To run all 3 tests, use: ANALYZE, COMPARE MEANS, and then select the type of...
 please show all 6 steps with calculations
Assignment #IS: Within Subjects ANOVA Instructions: For each research scenario, please complete the source table and conduct a hypothesis test at α-.05 significance level using a within-subjects ANOVA to determine if one condition is different from the others. Please be sure to show your work when performing mathematical operations. Please round all source table calculations to two decimal places Scenario 1. Dr. Smith has developed a new way to administer a GRE prep...
please show all 6 steps with calculations
Assignment #IS: Within Subjects ANOVA Instructions: For each research scenario, please complete the source table and conduct a hypothesis test at α-.05 significance level using a within-subjects ANOVA to determine if one condition is different from the others. Please be sure to show your work when performing mathematical operations. Please round all source table calculations to two decimal places Scenario 1. Dr. Smith has developed a new way to administer a GRE prep...
 please show all 6 steps with calculations!
Assignment # 1 3: Between-Subjects ANOVA Instructions: For each research scenario, please complete the source table and conduct a hypothesis test at a-05 significance level using a between-groups ANOVA to determine if one group is different from the others. Please be sure to show your work when performing mathematical operations. Please round all calculations to two decimal places. Scenario 1. Dr. Smith has developed a new way to administer a GRE prep workshop...
please show all 6 steps with calculations!
Assignment # 1 3: Between-Subjects ANOVA Instructions: For each research scenario, please complete the source table and conduct a hypothesis test at a-05 significance level using a between-groups ANOVA to determine if one group is different from the others. Please be sure to show your work when performing mathematical operations. Please round all calculations to two decimal places. Scenario 1. Dr. Smith has developed a new way to administer a GRE prep workshop...
 Researchers studied the effects of learning about the effectiveness of a new medication (Tal & Wansink, 2014). Some participants heard information about the medication; others heard the same information and saw a graph that depicted the data they had heard about. Thus, the two groups had identical information. Participants rated the effectiveness of the medication on a scale of 1-9, with 9 indicating a higher level of effectiveness. The researchers reported "Participants given graphs expressed greater belief in the claims,...
 please help with 4 & 6
3. For each of the following situations determine whether a one- or a two-tailed test is appropriate. Also, state the research and the null hypotheses. a. You are interested in finding out if the average household income of residents in your state is different from the national average household. According to the U.S. Census, for 2014, the national average household income is $53,657.15 b. You believe that students in small liberal arts colleges attend...
please help with 4 & 6
3. For each of the following situations determine whether a one- or a two-tailed test is appropriate. Also, state the research and the null hypotheses. a. You are interested in finding out if the average household income of residents in your state is different from the national average household. According to the U.S. Census, for 2014, the national average household income is $53,657.15 b. You believe that students in small liberal arts colleges attend...
Most questions answered within 3 hours.
-
Where is the error in this code sequence?
String s1 = "Hello";
String s2 = "ello";...
asked 1 year ago -
Financial data for Joel de Paris, Inc., for last year
follow:
Joel de Paris, Inc.
Balance...
asked 1 year ago -
Consider this reaction:
Al2(SO4)3 (aq)+ BaCl3
(aq) Al2Cl6 (aq)- +
3BaSO4(s) . What is the...
asked 1 year ago -
Suppose that Savneet is considering increasing her
recent random sample from 20 car rentals to 40...
asked 1 year ago -
Trucks arrive at an unloading terminal at an average rate of 120
per hour.
Trucks arrive...
asked 1 year ago -
Why are methanol and ethanol completely soluble in water while
octanol is not very little soluble....
asked 1 year ago -
A facilities manager at a university reads in a research report
that the mean amount of...
asked 1 year ago -
When the CuSO4 is rehydrated by adding water to the anhydrous
compound, is this an endothermic...
asked 1 year ago -
A ray of sunlight is passing from diamond into crown glass; the
angle of incidence is...
asked 1 year ago -
A block of mass 0.249 kg is placed on top of a light, vertical
spring of...
asked 1 year ago -
how do the kidneys compensate in the presences of acidosis
a) trigger hyperventilate
b) reserve acid...
asked 1 year ago -
Question 501 pts
The rental rate of capital to the firm increases. Which of the
following...
asked 1 year ago