
Homework Answers
Add Answer to:
Use the given graph to estimate the left Riemann sum for the given interval with the...
Use the given graph to estimate the left Riemann sum for the given interval with the stated numbe...
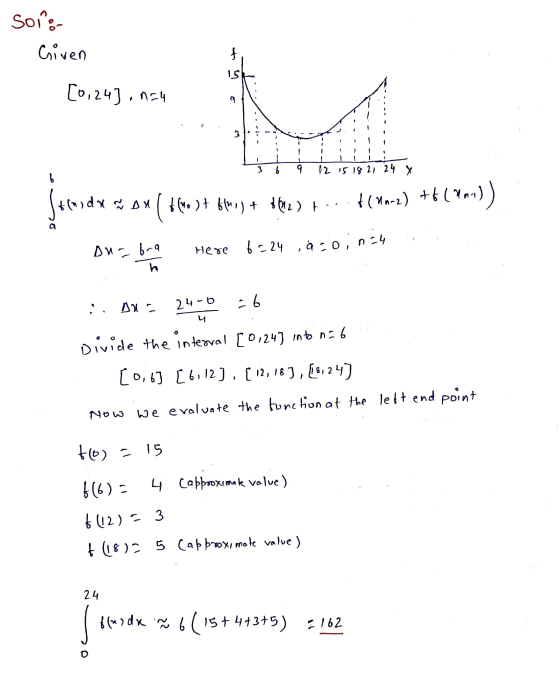
 Use the given graph to estimate the left Riemann sum for the given interval with the stated number of subdivisions. HINT [See Example 3.] (Round your answer to the nearest integer.) [0, 241, n = 4 20 12 15 21 3
Use the given graph to estimate the left Riemann sum for the given interval with the stated number of subdivisions. HINT [See Example 3.] (Round your answer to the nearest integer.) [0, 241, n = 4 20 12 15...
Use the given graph to estimate the left Riemann sum for the given interval with the stated number of subdivisions. HINT [See Example 3.] (Round your answer to the nearest integer.) [0, 241, n = 4 20 12 15 21 3
Use the given graph to estimate the left Riemann sum for the given interval with the stated number of subdivisions. HINT [See Example 3.] (Round your answer to the nearest integer.) [0, 241, n = 4 20 12 15...
4. [0/20 Points] DETAILS PREVIOUS ANSWERS WANEFMAC7 13.3.012.NVA MY NOTES Use the given graph to estimate...
 4. [0/20 Points] DETAILS PREVIOUS ANSWERS WANEFMAC7 13.3.012.NVA MY NOTES Use the given graph to estimate the left Riemann sum for the given interval with the stated number of subdivisions. HINT (See Example 3.] (Round your answer to the nearest integer.) [0, 16), n = 4 15 2 6 10 14 Need Help? Watch It Talk to a Tutor Submit Answer
Calculate the left Riemann sum for the given function over the given interval, using the given...
 Calculate the left Riemann sum for the given function over the given interval, using the given value of n. (When rounding, round your answer to four decimal places. places.) HINT [See Example 2.] f(x) = 27x2 over [-2, 2], n = 4 Need Help? Read It Watch It Talk to a Tutor -/1 points WANEAC7 6.3.007.MI. Calculate the left Riemann sum for the given function over the given interval, using the given value of n. (When rounding, round answers to...
Use the given graph of f on the interval [1, 7] to estimate the Riemann sum...
 Use
the given graph of f on the interval [1, 7] to estimate the Riemann
sum with three subintervals . Use left endpoints as the sample
points . Estimate all f(x) values to 1 decimal place, if necessary
. Show work
YA 11 0 1 T
Use
the given graph of f on the interval [1, 7] to estimate the Riemann
sum with three subintervals . Use left endpoints as the sample
points . Estimate all f(x) values to 1 decimal place, if necessary
. Show work
YA 11 0 1 T
Calculate the left Riemann sum for the given function over the given interval, using the given...
 Calculate the left Riemann sum for the given function over the given interval, using the given value of n. (When rounding, round your answer to four decimal places. If using the tabular method, values of the function in the table should be accurate to at least five decimal places.) HINT (See Example 2.) (x) = x over (1,5), n = 4 Enter an exact number. Need Help? Read Tato Tutor
Calculate the left Riemann sum for the given function over the given interval, using the given...
 Calculate the left Riemann sum for the given function over the given interval, using the given value of n. (When rounding, round your answer to four decimal places. If using the tabular method, values of the function in the table should be accurate to at least five decimal places.) HINT [See Example 2.] f(x) = 32 - 96x over [-1, 1], n = 4 Need Help? Read It Talk to a Tutor
Use the figures to calculate the left and right Riemann sums for f on the given...
 Use the figures to calculate the left and right Riemann sums for f on the given interval and the given value of n. 3 f(x) = + 1 on (1,5), n=4 0 1 2 3 0 1 2 3 4 5 The left Riemann sum fortis (Round to two decimal places as needed.) The right Riemann sum forf is (Round to two decimal places as needed.)
22 (1 point) a) The rectangles in the graph below illustrate a left endpoint Riemann sum...
 22 (1 point) a) The rectangles in the graph below illustrate a left endpoint Riemann sum for f(x) on the interval (2,6]. 9 The value of this Riemann sum is and this Riemann sum is an underestimate of the area of the region enclosed by y = f(x), the x-axis, and the vertical lines x = 2 and x = 6. y 8 7 6 5 4 3 2 1 X 1 2 3 4 5 6 7 8 Left...
by middle Riemann sum please~ not right and left ~Thank you 4-2 on the interval [-1,2],...
 by
middle Riemann sum please~ not right and left ~Thank you
4-2 on the interval [-1,2], and approximate [12] 1. (a) Sketch the graph of f(x) the area between the graph and the z-axis on [-1,2] by the left Riemann sum Ls using partitioning of the interval into 3 subintervals of equal length. b) For the same f(z) 4-12, write in sigma notation the formula for the left Riemann sum Ln with partitioning of the interval [-1,2 into n subintervals...
by
middle Riemann sum please~ not right and left ~Thank you
4-2 on the interval [-1,2], and approximate [12] 1. (a) Sketch the graph of f(x) the area between the graph and the z-axis on [-1,2] by the left Riemann sum Ls using partitioning of the interval into 3 subintervals of equal length. b) For the same f(z) 4-12, write in sigma notation the formula for the left Riemann sum Ln with partitioning of the interval [-1,2 into n subintervals...
Use a Riemann sum to approximate the area under the graph of f(x) = x2 on...
 Use a Riemann sum to approximate the area under the graph of f(x) = x2 on the interval 25x54 using n = 5 subintervals with the selected points as the left end points. The area is approximately (Type an integer or a decimal.)
 Use the given graph to estimate the left Riemann sum for the given interval with the stated number of subdivisions. HINT [See Example 3.] (Round your answer to the nearest integer.) [0, 241, n = 4 20 12 15 21 3
Use the given graph to estimate the left Riemann sum for the given interval with the stated number of subdivisions. HINT [See Example 3.] (Round your answer to the nearest integer.) [0, 241, n = 4 20 12 15...
Use the given graph to estimate the left Riemann sum for the given interval with the stated number of subdivisions. HINT [See Example 3.] (Round your answer to the nearest integer.) [0, 241, n = 4 20 12 15 21 3
Use the given graph to estimate the left Riemann sum for the given interval with the stated number of subdivisions. HINT [See Example 3.] (Round your answer to the nearest integer.) [0, 241, n = 4 20 12 15...
 4. [0/20 Points] DETAILS PREVIOUS ANSWERS WANEFMAC7 13.3.012.NVA MY NOTES Use the given graph to estimate the left Riemann sum for the given interval with the stated number of subdivisions. HINT (See Example 3.] (Round your answer to the nearest integer.) [0, 16), n = 4 15 2 6 10 14 Need Help? Watch It Talk to a Tutor Submit Answer
 Calculate the left Riemann sum for the given function over the given interval, using the given value of n. (When rounding, round your answer to four decimal places. places.) HINT [See Example 2.] f(x) = 27x2 over [-2, 2], n = 4 Need Help? Read It Watch It Talk to a Tutor -/1 points WANEAC7 6.3.007.MI. Calculate the left Riemann sum for the given function over the given interval, using the given value of n. (When rounding, round answers to...
 Use
the given graph of f on the interval [1, 7] to estimate the Riemann
sum with three subintervals . Use left endpoints as the sample
points . Estimate all f(x) values to 1 decimal place, if necessary
. Show work
YA 11 0 1 T
Use
the given graph of f on the interval [1, 7] to estimate the Riemann
sum with three subintervals . Use left endpoints as the sample
points . Estimate all f(x) values to 1 decimal place, if necessary
. Show work
YA 11 0 1 T
 Calculate the left Riemann sum for the given function over the given interval, using the given value of n. (When rounding, round your answer to four decimal places. If using the tabular method, values of the function in the table should be accurate to at least five decimal places.) HINT (See Example 2.) (x) = x over (1,5), n = 4 Enter an exact number. Need Help? Read Tato Tutor
 Calculate the left Riemann sum for the given function over the given interval, using the given value of n. (When rounding, round your answer to four decimal places. If using the tabular method, values of the function in the table should be accurate to at least five decimal places.) HINT [See Example 2.] f(x) = 32 - 96x over [-1, 1], n = 4 Need Help? Read It Talk to a Tutor
 Use the figures to calculate the left and right Riemann sums for f on the given interval and the given value of n. 3 f(x) = + 1 on (1,5), n=4 0 1 2 3 0 1 2 3 4 5 The left Riemann sum fortis (Round to two decimal places as needed.) The right Riemann sum forf is (Round to two decimal places as needed.)
 22 (1 point) a) The rectangles in the graph below illustrate a left endpoint Riemann sum for f(x) on the interval (2,6]. 9 The value of this Riemann sum is and this Riemann sum is an underestimate of the area of the region enclosed by y = f(x), the x-axis, and the vertical lines x = 2 and x = 6. y 8 7 6 5 4 3 2 1 X 1 2 3 4 5 6 7 8 Left...
 by
middle Riemann sum please~ not right and left ~Thank you
4-2 on the interval [-1,2], and approximate [12] 1. (a) Sketch the graph of f(x) the area between the graph and the z-axis on [-1,2] by the left Riemann sum Ls using partitioning of the interval into 3 subintervals of equal length. b) For the same f(z) 4-12, write in sigma notation the formula for the left Riemann sum Ln with partitioning of the interval [-1,2 into n subintervals...
by
middle Riemann sum please~ not right and left ~Thank you
4-2 on the interval [-1,2], and approximate [12] 1. (a) Sketch the graph of f(x) the area between the graph and the z-axis on [-1,2] by the left Riemann sum Ls using partitioning of the interval into 3 subintervals of equal length. b) For the same f(z) 4-12, write in sigma notation the formula for the left Riemann sum Ln with partitioning of the interval [-1,2 into n subintervals...
 Use a Riemann sum to approximate the area under the graph of f(x) = x2 on the interval 25x54 using n = 5 subintervals with the selected points as the left end points. The area is approximately (Type an integer or a decimal.)
Most questions answered within 3 hours.
-
Where is the error in this code sequence?
String s1 = "Hello";
String s2 = "ello";...
asked 10 months ago -
Financial data for Joel de Paris, Inc., for last year
follow:
Joel de Paris, Inc.
Balance...
asked 10 months ago -
Consider this reaction:
Al2(SO4)3 (aq)+ BaCl3
(aq) Al2Cl6 (aq)- +
3BaSO4(s) . What is the...
asked 10 months ago -
Suppose that Savneet is considering increasing her
recent random sample from 20 car rentals to 40...
asked 10 months ago -
Trucks arrive at an unloading terminal at an average rate of 120
per hour.
Trucks arrive...
asked 10 months ago -
Why are methanol and ethanol completely soluble in water while
octanol is not very little soluble....
asked 10 months ago -
A facilities manager at a university reads in a research report
that the mean amount of...
asked 10 months ago -
When the CuSO4 is rehydrated by adding water to the anhydrous
compound, is this an endothermic...
asked 10 months ago -
A ray of sunlight is passing from diamond into crown glass; the
angle of incidence is...
asked 10 months ago -
A block of mass 0.249 kg is placed on top of a light, vertical
spring of...
asked 10 months ago -
how do the kidneys compensate in the presences of acidosis
a) trigger hyperventilate
b) reserve acid...
asked 10 months ago -
Question 501 pts
The rental rate of capital to the firm increases. Which of the
following...
asked 10 months ago