
Homework Answers
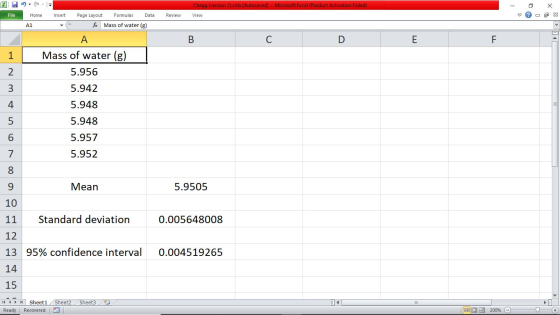
mean = 5.951 g
95 % confidence interval = +/- 0.005
(exact values are in the image below)
Add Answer to:
You obtain the following six measurements for the mass of water delivered by a special calibrated...
4. A student calibrates a 25-mL pipette by measuring the volume of the water it can...
 4. A student calibrates a 25-mL pipette by measuring the volume of the water it can transfer. The reading data are shown as follows (unit in mL): 24.75, 24.83, 24.87, 24.91, and 25.32 (a) Is there an outlier at the 95% confidence level? (b) Calculate the coefficient of variation based on the results from part (a). (c) Suppose the standard deviation of the liquid volume is 0.04 mL, how many replicate measurements would the student need to get 95% confidence...
tically you can open Assignment 1 here 4. A student calibrates a 25-mL pipette by measuring...
 tically you can open Assignment 1 here 4. A student calibrates a 25-mL pipette by measuring the volume of the water it can transfer. The reading data are shown as follows (unit in mL): 24.75, 24.83, 24.87, 24.91, and 25.32 (a) Is there an outlier at the 95% confidence level? (b) Calculate the coefficient of variation based on the results from part (a) (c) Suppose the standard deviation of the liquid volume is 0.04 mL, how many replicate measurements would...
You are checking the accuracy of a volumetric flask marked 10.00 mL. Measurement| Volume (mL) You...
 You are checking the accuracy of a volumetric flask marked 10.00 mL. Measurement| Volume (mL) You measure the volume of water contained in the flask by measuring the mass of the empty flask, the mass of the flask filled with water, taking the difference, correcting for the buoyancy factor, and dividing by the density of the water. The results of eight such measurements are given in the table 10.064 10.063 10.017 10.049 10.020 10.025 10.045 10.008 2 3 4 5...
6. You study a random variable that is known to be normally distributed. You obtain 21...
 6. You study a random variable that is known to be normally distributed. You obtain 21 independent measurements that yield a sample mean equal to 16.2 and a sample standard deviation equal to 3.90. Calculate the 95% confidence interval on the mean. There is a null hypothesis that the population mean is 15.0, and an altemate hypothesis that the population mean is greater than 15.0. Determine the P-value of that hypothesis test. (If it involves a Z-test, obtain the P-value...
You are checking the accuracy of a volumetric flask marked 10.00 mL . To calculate the...
You are checking the accuracy of a volumetric flask marked 10.00 mL . To calculate the volume of water contained in the flask, you first measure the mass of the empty flask and the mass of the flask filled with water and take the difference. Then, you correct for the buoyancy factor and divide by the density of the water. The result of 8 such measurements is given in the table. Calculate the mean and the 95% confidence interval for...
1. Calculate the average and standard deviation for the mass of water contained in the beaker....
 1. Calculate the average and standard deviation for the mass of water contained in the beaker. What does the standard deviation tell you about the precision of the beaker? Remember that you will use your data to support your choice in your discussion. a. フ-go2 TABLE 1.10 Beaker Calibration Calculations Trial 1 Trial 2 Trial 3 Trial 4 Trial 5 Trial 6 7.6 20 7.7907.770 7-7707.9727.755 7.6u3 7.994 7-793 7.8257.9963.02 フ·878らm4 mass water delivered volume water delivered average volume delivered...
Determine the errors of the volumetric devices. a. For each pipette determine the mean volume. You...
Determine the errors of the volumetric devices. a. For each pipette determine the mean volume. You will need to use the CRC, Perry’s Handbook or other reference to obtain the density of water at the lab temperature>>(THE DENSITY OF THE WATER WAS P = 0.9975412 +/- 0.0000001 g/mL (23o C) b. Use the propagation of error method to find the error in volume associated with each device. c. Calculate the percent uncertainty for each device, and percent error. For this...
Problem 2 (Health Data Measurements) One of the most important measurements related to your cardiovascular health is your heart rate, which is usually reported in beats per minute (BPM). If you go to...
 Problem 2 (Health Data Measurements) One of the most important measurements related to your cardiovascular health is your heart rate, which is usually reported in beats per minute (BPM). If you go to the doctor, they usually take a single measurement of this quantity. But your heart rate can fluctuate wildly throughout the day as a result of what you eat, stress, adrenaline, etc. In this problem, I would like you to determine the confidenc heart rate. You can do...
Six samples of each of four types of cereal grain grown in a certain region were analyzed to determine thiamin content,...
Six samples of each of four types of cereal grain grown in a certain region were analyzed to determine thiamin content, resulting in the following data (µg/g): Wheat Barley Maize Oats 5.2 6.5 5.8 8.3 4.5 8 4.7 6.1 6 6.1 6.4 7.8 6.1 7.5 4.9 7 6.7 5.9 6 5.5 5.8 5.6 5.2 7.2 a. Does this data suggest that at least two of the grains differ with respect to the true average thiamin content? Use a level α=.05...
Please Help with BOTH 1) 2) An article reported that for a sample of 56 kitchens...
 Please Help with BOTH
1)
2)
An article reported that for a sample of 56 kitchens with gas cooking appliances monitored during a one-week period, the sample mean CO2 level (ppm) was 654.16, and the sample standard deviation was 163.36. (a) Calculate and interpret a 95% (two-sided) confidence interval for true average CO2 level in the population of all homes from which the sample was selected. (Round your answers to two decimal places.) ppm Interpret the resulting interval. We are...
Please Help with BOTH
1)
2)
An article reported that for a sample of 56 kitchens with gas cooking appliances monitored during a one-week period, the sample mean CO2 level (ppm) was 654.16, and the sample standard deviation was 163.36. (a) Calculate and interpret a 95% (two-sided) confidence interval for true average CO2 level in the population of all homes from which the sample was selected. (Round your answers to two decimal places.) ppm Interpret the resulting interval. We are...
 4. A student calibrates a 25-mL pipette by measuring the volume of the water it can transfer. The reading data are shown as follows (unit in mL): 24.75, 24.83, 24.87, 24.91, and 25.32 (a) Is there an outlier at the 95% confidence level? (b) Calculate the coefficient of variation based on the results from part (a). (c) Suppose the standard deviation of the liquid volume is 0.04 mL, how many replicate measurements would the student need to get 95% confidence...
 tically you can open Assignment 1 here 4. A student calibrates a 25-mL pipette by measuring the volume of the water it can transfer. The reading data are shown as follows (unit in mL): 24.75, 24.83, 24.87, 24.91, and 25.32 (a) Is there an outlier at the 95% confidence level? (b) Calculate the coefficient of variation based on the results from part (a) (c) Suppose the standard deviation of the liquid volume is 0.04 mL, how many replicate measurements would...
 You are checking the accuracy of a volumetric flask marked 10.00 mL. Measurement| Volume (mL) You measure the volume of water contained in the flask by measuring the mass of the empty flask, the mass of the flask filled with water, taking the difference, correcting for the buoyancy factor, and dividing by the density of the water. The results of eight such measurements are given in the table 10.064 10.063 10.017 10.049 10.020 10.025 10.045 10.008 2 3 4 5...
 6. You study a random variable that is known to be normally distributed. You obtain 21 independent measurements that yield a sample mean equal to 16.2 and a sample standard deviation equal to 3.90. Calculate the 95% confidence interval on the mean. There is a null hypothesis that the population mean is 15.0, and an altemate hypothesis that the population mean is greater than 15.0. Determine the P-value of that hypothesis test. (If it involves a Z-test, obtain the P-value...
 1. Calculate the average and standard deviation for the mass of water contained in the beaker. What does the standard deviation tell you about the precision of the beaker? Remember that you will use your data to support your choice in your discussion. a. フ-go2 TABLE 1.10 Beaker Calibration Calculations Trial 1 Trial 2 Trial 3 Trial 4 Trial 5 Trial 6 7.6 20 7.7907.770 7-7707.9727.755 7.6u3 7.994 7-793 7.8257.9963.02 フ·878らm4 mass water delivered volume water delivered average volume delivered...
 Problem 2 (Health Data Measurements) One of the most important measurements related to your cardiovascular health is your heart rate, which is usually reported in beats per minute (BPM). If you go to the doctor, they usually take a single measurement of this quantity. But your heart rate can fluctuate wildly throughout the day as a result of what you eat, stress, adrenaline, etc. In this problem, I would like you to determine the confidenc heart rate. You can do...
 Please Help with BOTH
1)
2)
An article reported that for a sample of 56 kitchens with gas cooking appliances monitored during a one-week period, the sample mean CO2 level (ppm) was 654.16, and the sample standard deviation was 163.36. (a) Calculate and interpret a 95% (two-sided) confidence interval for true average CO2 level in the population of all homes from which the sample was selected. (Round your answers to two decimal places.) ppm Interpret the resulting interval. We are...
Please Help with BOTH
1)
2)
An article reported that for a sample of 56 kitchens with gas cooking appliances monitored during a one-week period, the sample mean CO2 level (ppm) was 654.16, and the sample standard deviation was 163.36. (a) Calculate and interpret a 95% (two-sided) confidence interval for true average CO2 level in the population of all homes from which the sample was selected. (Round your answers to two decimal places.) ppm Interpret the resulting interval. We are...
Most questions answered within 3 hours.
-
Where is the error in this code sequence?
String s1 = "Hello";
String s2 = "ello";...
asked 11 months ago -
Financial data for Joel de Paris, Inc., for last year
follow:
Joel de Paris, Inc.
Balance...
asked 11 months ago -
Consider this reaction:
Al2(SO4)3 (aq)+ BaCl3
(aq) Al2Cl6 (aq)- +
3BaSO4(s) . What is the...
asked 11 months ago -
Suppose that Savneet is considering increasing her
recent random sample from 20 car rentals to 40...
asked 11 months ago -
Trucks arrive at an unloading terminal at an average rate of 120
per hour.
Trucks arrive...
asked 11 months ago -
Why are methanol and ethanol completely soluble in water while
octanol is not very little soluble....
asked 11 months ago -
A facilities manager at a university reads in a research report
that the mean amount of...
asked 11 months ago -
When the CuSO4 is rehydrated by adding water to the anhydrous
compound, is this an endothermic...
asked 11 months ago -
A ray of sunlight is passing from diamond into crown glass; the
angle of incidence is...
asked 11 months ago -
A block of mass 0.249 kg is placed on top of a light, vertical
spring of...
asked 11 months ago -
how do the kidneys compensate in the presences of acidosis
a) trigger hyperventilate
b) reserve acid...
asked 11 months ago -
Question 501 pts
The rental rate of capital to the firm increases. Which of the
following...
asked 11 months ago