
Homework Answers
For sample size 4, A2 = 0.729, D4 = 2.282 and D3 = 0
a)

Formula
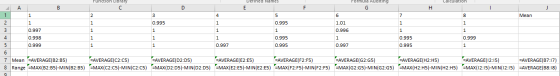
X-bar chart,
Center line = 0.99884375 = x-bar-bar
R-bar = 0.0045
UCL = x-bar-bar +A2*R-bar = 0.99884375+0.729*0.0045
= 1.00212425
LCL = x-bar-bar -A2*R-bar = 0.99884375-0.729*0.0045 =
0.99556325

Graph Data
| Center line | UCL | LCL | Sample mean |
| 0.99884375 | 1.002124 | 0.995563 | 0.9985 |
| 0.99884375 | 1.002124 | 0.995563 | 1 |
| 0.99884375 | 1.002124 | 0.995563 | 0.99875 |
| 0.99884375 | 1.002124 | 0.995563 | 0.99925 |
| 0.99884375 | 1.002124 | 0.995563 | 0.99625 |
| 0.99884375 | 1.002124 | 0.995563 | 1.00075 |
| 0.99884375 | 1.002124 | 0.995563 | 0.9975 |
| 0.99884375 | 1.002124 | 0.995563 | 0.99975 |
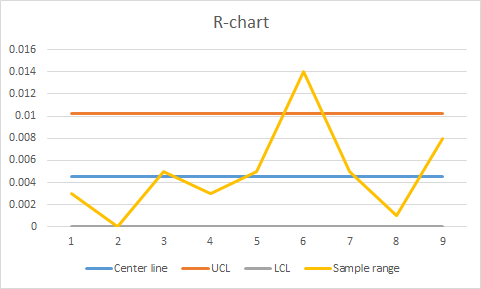
R-chart
Center line = 0.0045
UCL = D4*R-bar = 2.282*0.0045 = 0.010269
LCL = D3*R-bar = 0

Graph Data
| Center line | UCL | LCL | Sample range |
| 0.0045 | 0.010269 | 0 | 0.003 |
| 0.0045 | 0.010269 | 0 | 0 |
| 0.0045 | 0.010269 | 0 | 0.005 |
| 0.0045 | 0.010269 | 0 | 0.003 |
| 0.0045 | 0.010269 | 0 | 0.005 |
| 0.0045 | 0.010269 | 0 | 0.014 |
| 0.0045 | 0.010269 | 0 | 0.005 |
| 0.0045 | 0.010269 | 0 | 0.001 |
b)
No the process is not in control as Sample 6 range breaches upper control limit of Range chart
c)
Ninth sample mean = average(1,0.996,1,0.992) = 0.997 and Range =
1-0.992 = 0.008
With the inclusion of 9th sample,

If we assume that the process is already in control then adding sample 9 to the x-bar chart and R-chart do not alter the status.The process remains in control as Sample range and sample mean of the 9th sample are in previously calculated control chart limits
Add Answer to:
You are a quality control inspector for Southeast Texas Chemical Company (SETCCO). SETCCO manufactures lubricants for...
Most questions answered within 3 hours.
-
Where is the error in this code sequence?
String s1 = "Hello";
String s2 = "ello";...
asked 10 months ago -
Financial data for Joel de Paris, Inc., for last year
follow:
Joel de Paris, Inc.
Balance...
asked 10 months ago -
Consider this reaction:
Al2(SO4)3 (aq)+ BaCl3
(aq) Al2Cl6 (aq)- +
3BaSO4(s) . What is the...
asked 10 months ago -
Suppose that Savneet is considering increasing her
recent random sample from 20 car rentals to 40...
asked 10 months ago -
Trucks arrive at an unloading terminal at an average rate of 120
per hour.
Trucks arrive...
asked 10 months ago -
Why are methanol and ethanol completely soluble in water while
octanol is not very little soluble....
asked 10 months ago -
A facilities manager at a university reads in a research report
that the mean amount of...
asked 10 months ago -
When the CuSO4 is rehydrated by adding water to the anhydrous
compound, is this an endothermic...
asked 10 months ago -
A ray of sunlight is passing from diamond into crown glass; the
angle of incidence is...
asked 10 months ago -
A block of mass 0.249 kg is placed on top of a light, vertical
spring of...
asked 10 months ago -
how do the kidneys compensate in the presences of acidosis
a) trigger hyperventilate
b) reserve acid...
asked 10 months ago -
Question 501 pts
The rental rate of capital to the firm increases. Which of the
following...
asked 10 months ago