
Homework Answers

Add Answer to:
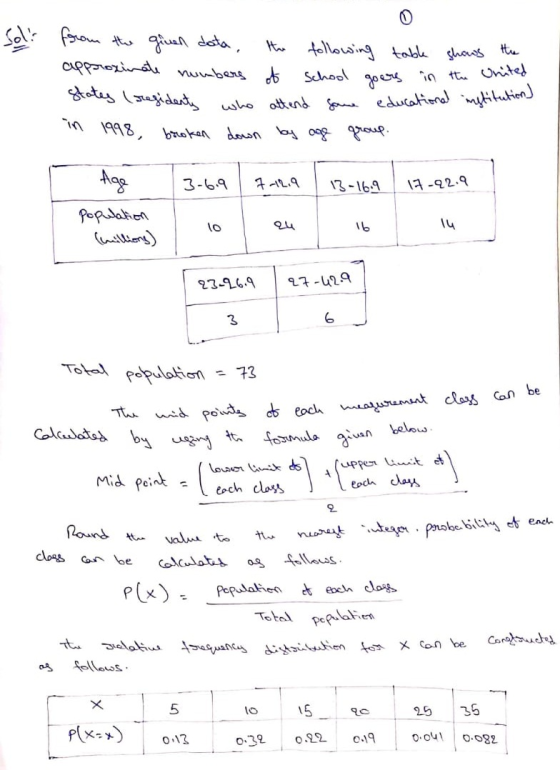
The following table shows the approximate numbers of school goers in the United States (residents who...
The table below shows the life expectancy for an individual born in the United States in...
The table below shows the life expectancy for an individual born in the United States in certain years. Year of Birth Life Expectancy CHART W NUMBERS IS BELOW Part (a) Decide which variable should be the independent variable and which should be the dependent variable. A)Independent: year of birth; Dependent: life expectancy Independent: life expectancy; B) Dependent: year of birth Incorrect: Your answer is incorrect. Part (b) Draw a scatter plot of the ordered pairs. Part (c) Calculate the least...
12. In 2015, 88% of US residents used the internet, up from 14% in 1995 The table shows the percent who use the internet for selected years from 2000 and projected to 2025. Year 2000 2005 2010 20...
 12. In 2015, 88% of US residents used the internet, up from 14% in 1995 The table shows the percent who use the internet for selected years from 2000 and projected to 2025. Year 2000 2005 2010 2015 2020 2025 Percent 67 79 82 88 95 98 Find the logarithmic function that models the percent p as a function of x, the number of years after 1990. State the correlation coefficient. a) b) Use the model to predict the percentage...
help please!!! The following table gives the number (lin millions) of men and women over the age of 24 at each level of educational attainment Did not College a Total Completed Some Gende...
 help please!!!
The following table gives the number (lin millions) of men and women over the age of 24 at each level of educational attainment Did not College a Total Completed Some Gender complete high school college graduate high school Males 12.9 15.9 96.3 30.7 90.8 128 41.31037 103.7 Females 12.8 25.7 31.8 17.8 200 62.5 78.1 Total 33.7 A What is the probability that a randomly selected person over the age of 24 did not complete high school?(answer with...
help please!!!
The following table gives the number (lin millions) of men and women over the age of 24 at each level of educational attainment Did not College a Total Completed Some Gender complete high school college graduate high school Males 12.9 15.9 96.3 30.7 90.8 128 41.31037 103.7 Females 12.8 25.7 31.8 17.8 200 62.5 78.1 Total 33.7 A What is the probability that a randomly selected person over the age of 24 did not complete high school?(answer with...
The following payoff table shows the profit for a decision problem with two states of nature and two decision alternatives: State of Nature Decision Alternative s1 s2 d1 10 1 d2 4 3 (a...
The following payoff table shows the profit for a decision problem with two states of nature and two decision alternatives: State of Nature Decision Alternative s1 s2 d1 10 1 d2 4 3 (a) Suppose P(s1)=0.2 and P(s2)=0.8. What is the best decision using the expected value approach? Round your answer in one decimal place. The best decision is decision alternative - Select your answer -d1d2Item 1 , with an expected value of . (b) Perform sensitivity analysis on the...
 12. In 2015, 88% of US residents used the internet, up from 14% in 1995 The table shows the percent who use the internet for selected years from 2000 and projected to 2025. Year 2000 2005 2010 2015 2020 2025 Percent 67 79 82 88 95 98 Find the logarithmic function that models the percent p as a function of x, the number of years after 1990. State the correlation coefficient. a) b) Use the model to predict the percentage...
 help please!!!
The following table gives the number (lin millions) of men and women over the age of 24 at each level of educational attainment Did not College a Total Completed Some Gender complete high school college graduate high school Males 12.9 15.9 96.3 30.7 90.8 128 41.31037 103.7 Females 12.8 25.7 31.8 17.8 200 62.5 78.1 Total 33.7 A What is the probability that a randomly selected person over the age of 24 did not complete high school?(answer with...
help please!!!
The following table gives the number (lin millions) of men and women over the age of 24 at each level of educational attainment Did not College a Total Completed Some Gender complete high school college graduate high school Males 12.9 15.9 96.3 30.7 90.8 128 41.31037 103.7 Females 12.8 25.7 31.8 17.8 200 62.5 78.1 Total 33.7 A What is the probability that a randomly selected person over the age of 24 did not complete high school?(answer with...
Most questions answered within 3 hours.
-
Where is the error in this code sequence?
String s1 = "Hello";
String s2 = "ello";...
asked 10 months ago -
Financial data for Joel de Paris, Inc., for last year
follow:
Joel de Paris, Inc.
Balance...
asked 10 months ago -
Consider this reaction:
Al2(SO4)3 (aq)+ BaCl3
(aq) Al2Cl6 (aq)- +
3BaSO4(s) . What is the...
asked 10 months ago -
Suppose that Savneet is considering increasing her
recent random sample from 20 car rentals to 40...
asked 10 months ago -
Trucks arrive at an unloading terminal at an average rate of 120
per hour.
Trucks arrive...
asked 10 months ago -
Why are methanol and ethanol completely soluble in water while
octanol is not very little soluble....
asked 10 months ago -
A facilities manager at a university reads in a research report
that the mean amount of...
asked 10 months ago -
When the CuSO4 is rehydrated by adding water to the anhydrous
compound, is this an endothermic...
asked 10 months ago -
A ray of sunlight is passing from diamond into crown glass; the
angle of incidence is...
asked 10 months ago -
A block of mass 0.249 kg is placed on top of a light, vertical
spring of...
asked 10 months ago -
how do the kidneys compensate in the presences of acidosis
a) trigger hyperventilate
b) reserve acid...
asked 10 months ago -
Question 501 pts
The rental rate of capital to the firm increases. Which of the
following...
asked 10 months ago