
Homework Answers
Add Answer to:
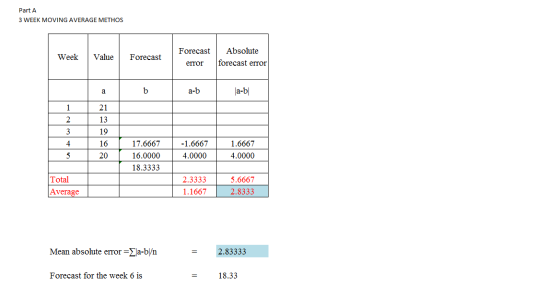
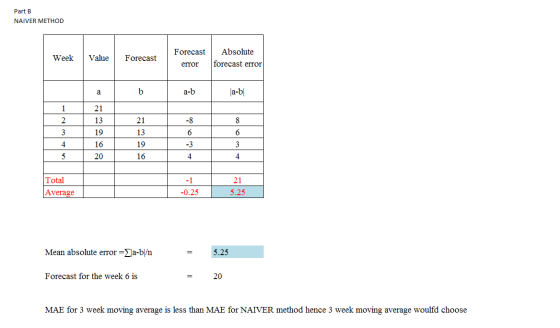
problem 2 only, no work necessary
2. Usage for a particular part at Acme Manufacturing over...
Problem 15-03 (Algorithmic) Consider the following time series data. Week 1 2 3 4 5 6...
Problem 15-03 (Algorithmic) Consider the following time series data. Week 1 2 3 4 5 6 Value 18 14 16 11 17 13 Using the naïve method (most recent value) as the forecast for the next week, compute the following measures of forecast accuracy: Mean absolute error (MAE) Mean squared error (MSE) Mean absolute percentage error (MAPE) Round your answers to two decimal places. MAE = MSE = MAPE = Using the average of all the historical data as a...
Problem 15-01 (Algorithmic) Consider the following time series data. Week 1 2 3 4 5 6...
Problem 15-01 (Algorithmic) Consider the following time series data. Week 1 2 3 4 5 6 Value 18 14 15 11 19 14 Using the naïve method (most recent value) as the forecast for the next week, compute the following measures of forecast accuracy. Mean absolute error. Round your answer to one decimal place. Mean squared error. Round your answer to one decimal place. Mean absolute percentage error. Round your answer to two decimal places. What is the forecast for...
Problem 15-01 (Algorithmic) Consider the following time series data. Week 1 2 3 4 5 6...
Problem 15-01 (Algorithmic) Consider the following time series data. Week 1 2 3 4 5 6 Value 18 13 15 10 19 13 Using the naïve method (most recent value) as the forecast for the next week, compute the following measures of forecast accuracy. Mean absolute error. Round your answer to one decimal place. ________________ Mean squared error. Round your answer to one decimal place. _________________ Mean absolute percentage error. Round your answer to two decimal places. ___________________ What is...
Consider the following time series data. Week 1 2 3 45 6 Value 19 12 15...
 Consider the following time series data. Week 1 2 3 45 6 Value 19 12 15 10 19 15 Using the naïve method (most recent value) as the forecast for the next week, compute the following measures of forecast accuracy. (a) Mean absolute error If required, round your answer to one decimal place. (b) Mean squared error If required, round your answer to one decimal place. (c) Mean absolute percentage error If required, round your intermediate calculations and final answer...
Consider the following time series data. Week 1 2 3 4 5 6 Value 1914 16...
 Consider the following time series data. Week 1 2 3 4 5 6 Value 1914 16 10 19 13 Using the naïve method (most recent value) as the forecast for the next week, compute the following measures of forecast accuracy. a. Mean absolute error. Round your answer to one decimal place. b. Mean squared error. Round your answer to one decimal place. c. Mean absolute percentage error. Round your answer to two decimal places. d. What is the forecast for...
Consider the following time series data. Week 1 2 3 4 5 6 Value 20 14...
Consider the following time series data. Week 1 2 3 4 5 6 Value 20 14 16 11 19 15 Using the naïve method (most recent value) as the forecast for the next week, compute the following measures of forecast accuracy. (a) Mean absolute error If required, round your answer to one decimal place. (b) Mean squared error If required, round your answer to one decimal place. (c) Mean absolute percentage error If required, round your intermediate calculations and final...
46. Consider the sales for six consecutive weeks for Sam’s Strawberries. The sales are in “flats”...
46. Consider the sales for six consecutive weeks for Sam’s Strawberries. The sales are in “flats” sold. Week Sales 1 16 2 18 3 14 4 10 5 20 6 22 I just need the answer of E . E problem a. Using a moving average with AP = 3, forecast the sales for weeks four through six. What is the forecast for week 6? 14.7 b) Use...
Problem 8-1 Consider the following time series data. Week Value 1 18 2 12 3 16...
 Problem 8-1 Consider the following time series data. Week Value 1 18 2 12 3 16 4 5 6 11 1914 Using the naïve method (most recent value) as the forecast for the next week, compute the following measures of forecast accuracy. (a) Mean absolute error If required, round your answer to one decimal place. (b) Mean squared error If required, round your answer to one decimal place. (c) Mean absolute percentage error If required, round your intermediate calculations and...
Problem 2: Forecasting (10 points) Given these sales figures over the last 6 weeks, your boss...
 Problem 2: Forecasting (10 points) Given these sales figures over the last 6 weeks, your boss needs you to test two different forecasting methods (parts a and b below) to determine which method is best. For your measure of "best", recommend to your boss that the company should use the method with the lowest mean absolute deviation (MAD). Then use that method to provide your forecast for week 7 in part c. Week >WN Unit Sold 523 587 622 601...
Problem 2: Forecasting (10 points) Given these sales figures over the last 6 weeks, your boss needs you to test two...
 Problem 2: Forecasting (10 points) Given these sales figures over the last 6 weeks, your boss needs you to test two different forecasting methods (parts a and b below) to determine which method is best. For your measure of "best", recommend to your boss that the company should use the method with the lowest mean absolute deviation (MAD). Then use that method to provide your forecast for week 7 in part c. Week UWN Unit Sold 523 587 622 601...
 Consider the following time series data. Week 1 2 3 45 6 Value 19 12 15 10 19 15 Using the naïve method (most recent value) as the forecast for the next week, compute the following measures of forecast accuracy. (a) Mean absolute error If required, round your answer to one decimal place. (b) Mean squared error If required, round your answer to one decimal place. (c) Mean absolute percentage error If required, round your intermediate calculations and final answer...
 Consider the following time series data. Week 1 2 3 4 5 6 Value 1914 16 10 19 13 Using the naïve method (most recent value) as the forecast for the next week, compute the following measures of forecast accuracy. a. Mean absolute error. Round your answer to one decimal place. b. Mean squared error. Round your answer to one decimal place. c. Mean absolute percentage error. Round your answer to two decimal places. d. What is the forecast for...
 Problem 8-1 Consider the following time series data. Week Value 1 18 2 12 3 16 4 5 6 11 1914 Using the naïve method (most recent value) as the forecast for the next week, compute the following measures of forecast accuracy. (a) Mean absolute error If required, round your answer to one decimal place. (b) Mean squared error If required, round your answer to one decimal place. (c) Mean absolute percentage error If required, round your intermediate calculations and...
 Problem 2: Forecasting (10 points) Given these sales figures over the last 6 weeks, your boss needs you to test two different forecasting methods (parts a and b below) to determine which method is best. For your measure of "best", recommend to your boss that the company should use the method with the lowest mean absolute deviation (MAD). Then use that method to provide your forecast for week 7 in part c. Week >WN Unit Sold 523 587 622 601...
 Problem 2: Forecasting (10 points) Given these sales figures over the last 6 weeks, your boss needs you to test two different forecasting methods (parts a and b below) to determine which method is best. For your measure of "best", recommend to your boss that the company should use the method with the lowest mean absolute deviation (MAD). Then use that method to provide your forecast for week 7 in part c. Week UWN Unit Sold 523 587 622 601...
Most questions answered within 3 hours.
-
Where is the error in this code sequence?
String s1 = "Hello";
String s2 = "ello";...
asked 10 months ago -
Financial data for Joel de Paris, Inc., for last year
follow:
Joel de Paris, Inc.
Balance...
asked 10 months ago -
Consider this reaction:
Al2(SO4)3 (aq)+ BaCl3
(aq) Al2Cl6 (aq)- +
3BaSO4(s) . What is the...
asked 10 months ago -
Suppose that Savneet is considering increasing her
recent random sample from 20 car rentals to 40...
asked 10 months ago -
Trucks arrive at an unloading terminal at an average rate of 120
per hour.
Trucks arrive...
asked 10 months ago -
Why are methanol and ethanol completely soluble in water while
octanol is not very little soluble....
asked 10 months ago -
A facilities manager at a university reads in a research report
that the mean amount of...
asked 10 months ago -
When the CuSO4 is rehydrated by adding water to the anhydrous
compound, is this an endothermic...
asked 10 months ago -
A ray of sunlight is passing from diamond into crown glass; the
angle of incidence is...
asked 10 months ago -
A block of mass 0.249 kg is placed on top of a light, vertical
spring of...
asked 10 months ago -
how do the kidneys compensate in the presences of acidosis
a) trigger hyperventilate
b) reserve acid...
asked 10 months ago -
Question 501 pts
The rental rate of capital to the firm increases. Which of the
following...
asked 10 months ago