
Homework Answers
Add Answer to:
homework help
1) (18 points total) You wish to determine if the variance of a variable...
A manufacturer would like to determine if the variance in a product dimension exceeds 10. a)...
A manufacturer would like to determine if the variance in a product dimension exceeds 10. a) State the Hypothesis to show the variance is greater than 10. b) Choose a level of alpha.Use a = 0.05 for this problem. c) To test the hypothesis, the manufacturer takes a sample of 18 parts and measure that product dimension. The data appear in the Dimension worksheet of the HW3 data workbook on Moodle. Collect data and calculate necessary statistics to test the...
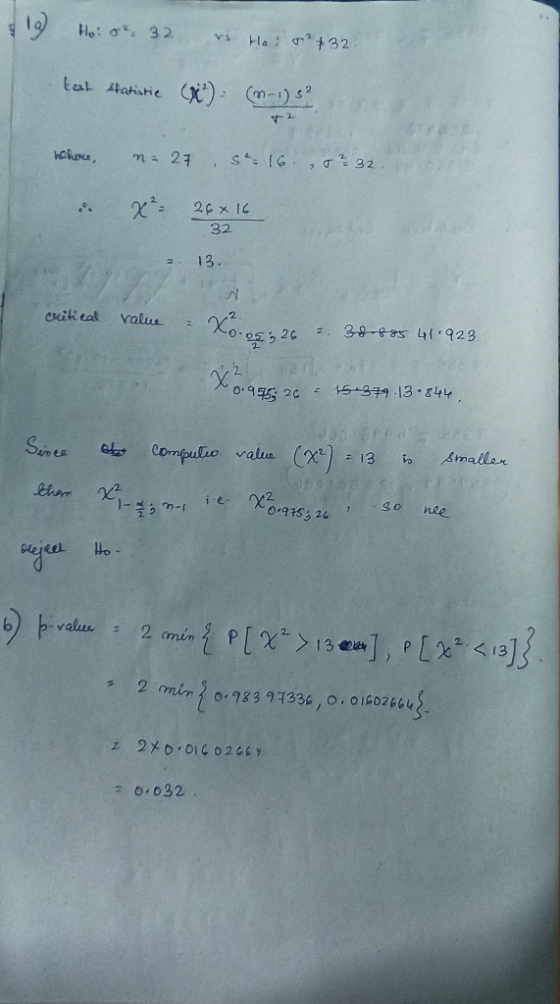
4) Previous experience shows the variance of a given process to be 14. a) State the...
4) Previous experience shows the variance of a given process to be 14. a) State the Hypothesis to determine if the process variance has changed. b) Choose a level of a Use a = 0.05 for this problem. c) To test the hypothesis, the researchers take a sample of 12. The data appear in the Process worksheet of the HW3 data workbook on Moodle. Collect data and calculate necessary statistics to test the hypothesis. d) Sketch the sampling distribution. Include...
3) A manufacturer would like to determine if the variance in a product dimension exceeds 10....
3) A manufacturer would like to determine if the variance in a product dimension exceeds 10. a) State the Hypothesis to show the variance is greater than 10. b) Choose a level of a Use a= 0.05 for this problem. c) To test the hypothesis, the manufacturer takes a sample of 18 parts and measure that product dimension. The data appear in the Dimension worksheet of the HW3 data workbook on Moodle. Collect data and calculate necessary statistics to test...
7/23/2020 Chapter 11 Homework-Lisa Jordan 6. Conduct the following test at the a= 0.01 level of...
 7/23/2020 Chapter 11 Homework-Lisa Jordan 6. Conduct the following test at the a= 0.01 level of significance by determining (a) the null and alternative hypotheses, (b) the test statistic, and (c) the critical value. Assume that the samples were obtained independently using simple random sampling Test whether p1 # P2. Sample data are x1 = 30, n = 254, X2 = 38 and n2 = 302. (a) Determine the null and alternative hypotheses. Choose the correct answer below. Ho: P1...
Suppose you wish to determine if the mean IQ of students on a certain campus is...
Suppose you wish to determine if the mean IQ of students on a certain campus is different from the mean IQ in the general population, 100. To conduct this study, you obtain a simple random sample of 80 students on this campus, administer an IQ test, and record the results. The mean IQ of the sample of 80 students is found to be 108.5 with a standard deviation of 12.9. Complete parts (a) through (c) below. Determine the critical value(s)...
You wish to test the following claim ( H a ) at a significance level of...
You wish to test the following claim ( H a ) at a significance level of α = 0.05 . H o : p 1 = p 2 H a : p 1 ≠ p 2 You obtain 63.1% successes in a sample of size n 1 = 203 from the first population. You obtain 80.9% successes in a sample of size n 2 = 230 from the second population. For this test, you should NOT use the continuity correction,...
You wish to test the claim that the mean GPA of night students is than 2.5...
You wish to test the claim that the mean GPA of night students is than 2.5 at the 0.05 significance level. Based on a sample of 45 people, the sample mean GPA was 2.47 with a standard deviation of 0.05. When finding the critical value and test statistic, which distribution would we be using? Normal distribution (invNorm for critical value) T distribution (invT for critical value) χ2χ2 distribution (invχχ for critical value) F distribution (invF for critical value)
Homework > Homework 7.2 You wish to test the following claim (H) at a significance level...
 Homework > Homework 7.2 You wish to test the following claim (H) at a significance level of a = 0.001. For the context of this problem, Md = M2 - My where the first data set represents a pre-test and the second data set represents a post-test. H:Hd = 0 Taith to You believe the population of difference scores is normally distributed, but you do not know the standard deviation. You obtain pre-test and post-test samples for n = 11...
You wish to conduct a hypothesis test to determine if a bivariate data set has a...
You wish to conduct a hypothesis test to determine if a bivariate data set has a significant correlation among the two variables. That is, you wish to test the claim that there is a correlation (Ha:ρ≠0Ha:ρ≠0). You have a data set with 69 subjects, in which two variables were collected for each subject. You will conduct the test at a significance level of α=0.05α=0.05. Find the critical value for this test (Pick the closest conservative value from the table). rc.v....
a random sample of 80 graduate students 1 (6 points). A random sample of 80 graduate...
 a random sample of 80 graduate students
1 (6 points). A random sample of 80 graduate students shows that 22 students have shopped online in the past year. Is there enough evidence to show that the true population proportion is lower than 60%? Conduct the test at 10% level of significance. (a) H : type of test (circle one): H: two-sided / left tail / right tail (b) What is the distribution of the test statistic? (c) Sketch a graph...
a random sample of 80 graduate students
1 (6 points). A random sample of 80 graduate students shows that 22 students have shopped online in the past year. Is there enough evidence to show that the true population proportion is lower than 60%? Conduct the test at 10% level of significance. (a) H : type of test (circle one): H: two-sided / left tail / right tail (b) What is the distribution of the test statistic? (c) Sketch a graph...
 7/23/2020 Chapter 11 Homework-Lisa Jordan 6. Conduct the following test at the a= 0.01 level of significance by determining (a) the null and alternative hypotheses, (b) the test statistic, and (c) the critical value. Assume that the samples were obtained independently using simple random sampling Test whether p1 # P2. Sample data are x1 = 30, n = 254, X2 = 38 and n2 = 302. (a) Determine the null and alternative hypotheses. Choose the correct answer below. Ho: P1...
 Homework > Homework 7.2 You wish to test the following claim (H) at a significance level of a = 0.001. For the context of this problem, Md = M2 - My where the first data set represents a pre-test and the second data set represents a post-test. H:Hd = 0 Taith to You believe the population of difference scores is normally distributed, but you do not know the standard deviation. You obtain pre-test and post-test samples for n = 11...
 a random sample of 80 graduate students
1 (6 points). A random sample of 80 graduate students shows that 22 students have shopped online in the past year. Is there enough evidence to show that the true population proportion is lower than 60%? Conduct the test at 10% level of significance. (a) H : type of test (circle one): H: two-sided / left tail / right tail (b) What is the distribution of the test statistic? (c) Sketch a graph...
a random sample of 80 graduate students
1 (6 points). A random sample of 80 graduate students shows that 22 students have shopped online in the past year. Is there enough evidence to show that the true population proportion is lower than 60%? Conduct the test at 10% level of significance. (a) H : type of test (circle one): H: two-sided / left tail / right tail (b) What is the distribution of the test statistic? (c) Sketch a graph...
Most questions answered within 3 hours.
-
Where is the error in this code sequence?
String s1 = "Hello";
String s2 = "ello";...
asked 10 months ago -
Financial data for Joel de Paris, Inc., for last year
follow:
Joel de Paris, Inc.
Balance...
asked 10 months ago -
Consider this reaction:
Al2(SO4)3 (aq)+ BaCl3
(aq) Al2Cl6 (aq)- +
3BaSO4(s) . What is the...
asked 10 months ago -
Suppose that Savneet is considering increasing her
recent random sample from 20 car rentals to 40...
asked 10 months ago -
Trucks arrive at an unloading terminal at an average rate of 120
per hour.
Trucks arrive...
asked 10 months ago -
Why are methanol and ethanol completely soluble in water while
octanol is not very little soluble....
asked 10 months ago -
A facilities manager at a university reads in a research report
that the mean amount of...
asked 10 months ago -
When the CuSO4 is rehydrated by adding water to the anhydrous
compound, is this an endothermic...
asked 10 months ago -
A ray of sunlight is passing from diamond into crown glass; the
angle of incidence is...
asked 10 months ago -
A block of mass 0.249 kg is placed on top of a light, vertical
spring of...
asked 10 months ago -
how do the kidneys compensate in the presences of acidosis
a) trigger hyperventilate
b) reserve acid...
asked 10 months ago -
Question 501 pts
The rental rate of capital to the firm increases. Which of the
following...
asked 10 months ago