 The following data represent
the number of male and female murder victims by age in a recent
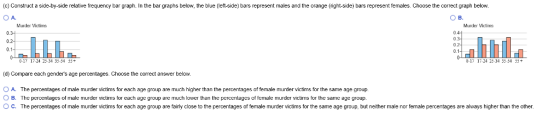
year. Use the data to complete parts? a-d.
The following data represent
the number of male and female murder victims by age in a recent
year. Use the data to complete parts? a-d.
Homework Answers

Add Answer to:
The following data represent
the number of male and female murder victims by age in a...
The data represent the number of driving fatalities for a certain area by age for male...
 The data represent the number of driving fatalities for a certain area by age for male and female drivers. Male Female under 16 197 141 16-20 6278 2243 21-34 13.950 4260 35-54 11037 5125 55-69 40812167 70 and over 3400 1641 (a) What is the probability that a randomly selected driver fatality who was male was 16 to 20 years old? The probability that a randomly selected driver fatality who was male was 15 to 20 years old is approximately...
34. Male versus Female Drivers The following data represent the number of licensed drivers in var...
 34. Male versus Female Drivers The following data represent the number of licensed drivers in various age groups and the number of fatal accidents within the age group by gender. Age Number of Number Number of Number Male Licensed of Fatal Female Licensed of Fatal Drivers (000s) Crashes Drivers (000s) Crashes 12 6.139 6,816 17664 20,063 19,984 4.441 8,400 5,375 227 5,180 5,016 8,595 7990 7,118 4,527 2,274 2.022 12 6,424 6,941 18,068 20,406 19,898 14,340 8,194 4,803 2,113 1.531...
The data represent the number of driving fatalities for a certain area by age for male...
The data represent the number of driving fatalities for a certain area by age for male and female drivers. Male Female under 16 114 102 16 dash 20 4198 2139 21 dash 34 14 comma 809 4339 35 dash 54 12 comma 910 5252 55 dash 69 4103 2476 70 and over 2776 1629 (a) What is the probability that a randomly selected driver fatality who was female was 55 to 69 years old?
The data represent the number of driving fatalities for a certain area by age for male...
 The data represent the number of driving fatalities for a certain area by age for male and female drivers. Male Female under 16 258 126 16-20 5225 2366 21-34 12,016 4704 35.54 10,191 4593 55.69 4591 1631 70 and over 3380 1258 (a) What is the probability that a randomly selected driver fatality who was male was 55 to 69 years old? The probability that a randomly selected driver fatality who was male was 55 to 69 years old is...
The data represent the number of driving fatalities for a certain area by age for male...
The data represent the number of driving fatalities for a certain area by age for male and female drivers. MaleMale FemaleFemale under 16under 16 167167 127127 16 dash 2016-20 55945594 21572157 21 dash 3421-34 14 comma 61514,615 48214821 35 dash 5435-54 11 comma 26911,269 45754575 55 dash 6955-69 44544454 16791679 70 and over70 and over 29922992 10331033 (a) What is the probability that a randomly selected driver fatality who was malemale was 55 to 6955 to 69 years old?The probability...
Problem 2 Here is a two-way table of Census Bureau data describing the age and sex...
 Problem 2 Here is a two-way table of Census Bureau data describing the age and sex of all American undergraduate college students. The table entries are counts in thousands of students. We suspect that the percent of women is higher among older students than in the traditional 20 to 24 college age group. Do the data support this suspicion? Age group Female Male Find relevant percentages and explain. 15 to 19 years 2124 1876 20 to 24 years 2814 2648...
The data in the table represent the number of licensed drivers in various age groups and...
 The data in the table represent the number of licensed drivers in various age groups and the number of fatal accidents within the age group by gender. Complete parts (a) through (c) below. Click the icon to view the data table (a) Find the least-squares regression line for males treating the number of licensed drivers as the explanatory variable, x, and the number of fatal crashes, y, as the response variable. Repeat this procedure for females Press Continue to see...
Male and female populations of tortoises under 80 years old are represented by age in the...
 Male and female populations of tortoises under 80 years old are represented by age in the table below. Complete parts (a) through (d). (a) Approximate the population mean and standard deviation of age for males (Round to two decimal places as needed.) Males Females 8 Age 0-9 10-19 20-29 30-39 10 16 9 (Round to two decimal places as needed.) (6) Approximate the population mean and standard deviation of age for females. 16 17 16 21 19 20 25 HE...
What is the age distribution of promotion-sensitive shoppers? A supermarket super shopper is defined as a...
What is the age distribution of promotion-sensitive shoppers? A supermarket super shopper is defined as a shopper for whom at least 70% of the items purchased were on sale or purchased with a coupon. Age range, years 18-28 29-39 40-50 51-61 62 and over Midpoint x 23 34 45 56 67 Percent of super shoppers 8% 41% 19% 9% 23% For the 62-and-over group, use the midpoint 67 years. (a) Using the age midpoints x and the percentage of super...
The data in the table represent the number of licensed drivers in various age groups and...
 The data in the table represent the number of licensed drivers in various age groups and the number of fatal accidents within the age group by gender complete parts ( Click the icon to view the datatable rough l o w (a) Find the stars regression informales treating the number of licensed drivers as the explanatory variable, and the number of Matalashes procedure for me as the response variable. Repeat this Find the least regression informales Round the concient to...
 The data represent the number of driving fatalities for a certain area by age for male and female drivers. Male Female under 16 197 141 16-20 6278 2243 21-34 13.950 4260 35-54 11037 5125 55-69 40812167 70 and over 3400 1641 (a) What is the probability that a randomly selected driver fatality who was male was 16 to 20 years old? The probability that a randomly selected driver fatality who was male was 15 to 20 years old is approximately...
 34. Male versus Female Drivers The following data represent the number of licensed drivers in various age groups and the number of fatal accidents within the age group by gender. Age Number of Number Number of Number Male Licensed of Fatal Female Licensed of Fatal Drivers (000s) Crashes Drivers (000s) Crashes 12 6.139 6,816 17664 20,063 19,984 4.441 8,400 5,375 227 5,180 5,016 8,595 7990 7,118 4,527 2,274 2.022 12 6,424 6,941 18,068 20,406 19,898 14,340 8,194 4,803 2,113 1.531...
 The data represent the number of driving fatalities for a certain area by age for male and female drivers. Male Female under 16 258 126 16-20 5225 2366 21-34 12,016 4704 35.54 10,191 4593 55.69 4591 1631 70 and over 3380 1258 (a) What is the probability that a randomly selected driver fatality who was male was 55 to 69 years old? The probability that a randomly selected driver fatality who was male was 55 to 69 years old is...
 Problem 2 Here is a two-way table of Census Bureau data describing the age and sex of all American undergraduate college students. The table entries are counts in thousands of students. We suspect that the percent of women is higher among older students than in the traditional 20 to 24 college age group. Do the data support this suspicion? Age group Female Male Find relevant percentages and explain. 15 to 19 years 2124 1876 20 to 24 years 2814 2648...
 The data in the table represent the number of licensed drivers in various age groups and the number of fatal accidents within the age group by gender. Complete parts (a) through (c) below. Click the icon to view the data table (a) Find the least-squares regression line for males treating the number of licensed drivers as the explanatory variable, x, and the number of fatal crashes, y, as the response variable. Repeat this procedure for females Press Continue to see...
 Male and female populations of tortoises under 80 years old are represented by age in the table below. Complete parts (a) through (d). (a) Approximate the population mean and standard deviation of age for males (Round to two decimal places as needed.) Males Females 8 Age 0-9 10-19 20-29 30-39 10 16 9 (Round to two decimal places as needed.) (6) Approximate the population mean and standard deviation of age for females. 16 17 16 21 19 20 25 HE...
 The data in the table represent the number of licensed drivers in various age groups and the number of fatal accidents within the age group by gender complete parts ( Click the icon to view the datatable rough l o w (a) Find the stars regression informales treating the number of licensed drivers as the explanatory variable, and the number of Matalashes procedure for me as the response variable. Repeat this Find the least regression informales Round the concient to...
Most questions answered within 3 hours.
-
Where is the error in this code sequence?
String s1 = "Hello";
String s2 = "ello";...
asked 11 months ago -
Financial data for Joel de Paris, Inc., for last year
follow:
Joel de Paris, Inc.
Balance...
asked 11 months ago -
Consider this reaction:
Al2(SO4)3 (aq)+ BaCl3
(aq) Al2Cl6 (aq)- +
3BaSO4(s) . What is the...
asked 11 months ago -
Suppose that Savneet is considering increasing her
recent random sample from 20 car rentals to 40...
asked 11 months ago -
Trucks arrive at an unloading terminal at an average rate of 120
per hour.
Trucks arrive...
asked 11 months ago -
Why are methanol and ethanol completely soluble in water while
octanol is not very little soluble....
asked 11 months ago -
A facilities manager at a university reads in a research report
that the mean amount of...
asked 11 months ago -
When the CuSO4 is rehydrated by adding water to the anhydrous
compound, is this an endothermic...
asked 11 months ago -
A ray of sunlight is passing from diamond into crown glass; the
angle of incidence is...
asked 11 months ago -
A block of mass 0.249 kg is placed on top of a light, vertical
spring of...
asked 11 months ago -
how do the kidneys compensate in the presences of acidosis
a) trigger hyperventilate
b) reserve acid...
asked 11 months ago -
Question 501 pts
The rental rate of capital to the firm increases. Which of the
following...
asked 11 months ago