


Homework Answers
NOTE- It's your graph you uploaded in the question on basis of that the answer below is given:
I would suggest you to choose the mean or median to summarize the center of this distribution.
Mean or median will tell us that where the data is highly densed and where the data is low densed.
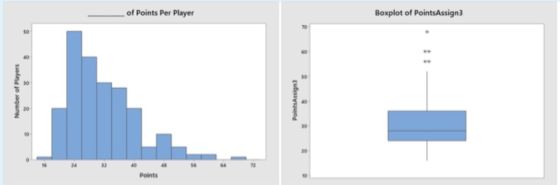
Like in graph 1: it shows that tail to the right of the curve has covered more area than the left. Here, median will help you out in partioning the data and saying that this value is grater than the median value and this value is less than the median value.
And yes, the above graph is positively skewed.
Now,the graph 2 represents the similar thing because it belongs to the same dataset, this boxplot also shows that data is positively skewed and it shows that it's median lies somewhere between the 20-30.
-> Features of the distribution:
Mode - As you can see in graph 1 the highest peak lies on the number of players at 50 and points corresponding to it is 24, Hence 24 is our mode.
Symmetry- As i have already told you above that tail towards th right has more area in it which represents that this curve is positively skewed.
Outliers- You can clearly see the outliers in both the graphs, in graph 1 blar in between the 64 and 72 represents the outlier and in graph 2 points outside the whiskers of the boxplot i.e., 5 points (above 50 points) are the outliers.
-> Features of display that are visible in graph 1 but not in graph 2.
There are two features that you can find in graph 1 but not in graph 2 i.e., are as followed:
1. Mode- You cannot locate the mode in the boxplot visualization but you can findout by the summary data it given in the result.
2. Mean- It is also not possible to locate mean as well in the boxplot directly. Because boxplot gives description about the partioning of the datatset.
-> Eerything required to create the boxplot would be calculated as followed:

NOTE- Q3, Q1 was given in the problem that's why i have not shown its calculation above.
This shows that there is one outlier in the dataset, all the values below 10.75 and above 72.75 would be considered as outliers and here 10 is below the fences (i.e., 10.75).
Boxplot would be as followed:
Add Answer to:
Q1
Q2
We will be examining the variable number of points per player for the 210...
Use basic C++ 3. A text file, superstars.txt, contains statistics on cricket players. For each player,...
 Use basic C++
3. A text file, superstars.txt, contains statistics on cricket players. For each player, the file contains the player's first name, last name, number of matches played, total number of runs scored, number of times the player scored 100 runs in a match, and the number of wickets taken. The last row of data in the file contains the word "END" only. Some rows are shown below 30 11867 164 Chanderpaul Shivnarine 34 11912 130 Lara Brian 73...
Use basic C++
3. A text file, superstars.txt, contains statistics on cricket players. For each player, the file contains the player's first name, last name, number of matches played, total number of runs scored, number of times the player scored 100 runs in a match, and the number of wickets taken. The last row of data in the file contains the word "END" only. Some rows are shown below 30 11867 164 Chanderpaul Shivnarine 34 11912 130 Lara Brian 73...
For each variable of interest, do the following: 1. Find the mean, five-number summary, range, variance,...
For each variable of interest, do the following: 1. Find the mean, five-number summary, range, variance, and standard deviation. Display these numbers in a format that is easy to understand. 2. For each variable of interest, use its five-number summary to construct a boxplot. Each boxplot must be constructed horizontally, and must be accompanied by a brief descriptive paragraph that assesses whether the data appear to be symmetrical, left-skewed, or right-skewed. Construct a 95% confidence interval for the mean μ...
I literally have no idea what I’m doing. Help!!! Please show work!! Write an essay using...
 I literally have no idea what I’m doing. Help!!! Please show
work!!
Write an essay using Word and post it as an attachment to the discussion. Cover the following points. Choose a data set from Stat Disk using one of the following files from 13th Edition Elementary Statistics: Oscar Winner Freshman 15 Word Count Garbage Weights Passive and Active Smoke If the file contains more than one variable, choose a quantitative variable. Create a histogram using your chosen variable and...
I literally have no idea what I’m doing. Help!!! Please show
work!!
Write an essay using Word and post it as an attachment to the discussion. Cover the following points. Choose a data set from Stat Disk using one of the following files from 13th Edition Elementary Statistics: Oscar Winner Freshman 15 Word Count Garbage Weights Passive and Active Smoke If the file contains more than one variable, choose a quantitative variable. Create a histogram using your chosen variable and...
48 57 Amy Bakery has four shops in different area in a city. Monthly sales (in...
 48 57 Amy Bakery has four shops in different area in a city. Monthly sales (in thousands of dollars) from a random of 24 months from each of the 4 shops given in Table 1. Table 1: Monthly sales (in thousands of dollars) North East South West 77 75 97 60 45 42 60 54 56 49 68 47 44 39 58 57 63 61 69 51 75 63 79 50 90 81 99 73 32 47 46 41 41...
Question 1 Use the data below to answer the questions that follow. The table below gives...
 Question 1 Use the data below to answer the questions that follow. The table below gives the approximate salaries (in millions of dollars) of the 13 members of the Los Angeles Lakers basketball team for the 2011-2012 season. Player Kobe Bryant Pau Gasol Andrew Bynum Lamar Odom Metta World Peace Luke Walton Steve Blake Salary Player 25.2 millon Derek Fisher 18.7 millon Matt Barnes 15.2 millon Troy Murphy 8.9 millon Jason Kapono 6.8 millon Derrick Caracter 5.7 millon Devin Ebanks...
Question 6 Select one answer. Based on the results of a nation-wide study, the number of...
 Question 6 Select one answer. Based on the results of a nation-wide study, the number of contacts programmed into cell phones are summarized on the following boxplot: 10 points 1 25 50 75 100 125 150 175 200 225 Which of the following is true about this data? A. ︵ The lowest observation is an outlier. B. O The highest observation is an outlier. C. The data is skewed left. D. O The data is skewed right. E. O There...
Problem 4: Variables that may affect Grades The data set contains a random sample of STAT 250 Final Exam Scores out of 80 points. For each individual sampled, the time (in hours per week) that the stu...
Problem 4: Variables that may affect Grades The data set contains a random sample of STAT 250 Final Exam Scores out of 80 points. For each individual sampled, the time (in hours per week) that the student spent participating in a GMU club or sport and working for pay outside of GMU was recorded. Values of 0 indicate the students either does not participate in a club or sport or does not work a job for pay. The goal of...
Please answer all of the following. The boxplot below shows the number of contacts in their...
 Please answer all of the following.
The boxplot below shows the number of contacts in their cell by gender for my Spring 2018 statistics classes. Using the boxplot, answer the 4 questions below. Boxplot of CellNumbers 900 800 700 600 500 400 300 200 100 0 Male Female Gender CellNumbers Which distribution has 3 outliers? Which distribution appears skewed right, excluding 1. Male 1 outliers? 2. Female Which distribution is 1 3. Both less variable (has the smaller IQR)? 4....
Please answer all of the following.
The boxplot below shows the number of contacts in their cell by gender for my Spring 2018 statistics classes. Using the boxplot, answer the 4 questions below. Boxplot of CellNumbers 900 800 700 600 500 400 300 200 100 0 Male Female Gender CellNumbers Which distribution has 3 outliers? Which distribution appears skewed right, excluding 1. Male 1 outliers? 2. Female Which distribution is 1 3. Both less variable (has the smaller IQR)? 4....
Q2. Hypothesis Testing with a Z test (14 points total) A research institute examined the number...
Q2. Hypothesis Testing with a Z test (14 points total) A research institute examined the number of smart phones and tablets connected to the internet in American households and reported a mean (μ) of 5 devices per household and a standard deviation (σ) of 1.5 devices. But I wonder if the statistics in my neighborhood, Chandler, would be different from the national average. To test this idea, I randomly picked 16 friends of mine living in Chandler and asked them...
python question Question 1 Write a Python program to play two games. The program should be...
 python question
Question 1 Write a Python program to play two games. The program should be menu driven and should use different functions to play each game. Call the file containing your program fun games.py. Your program should include the following functions: • function guess The Number which implements the number guessing game. This game is played against the computer and outputs the result of the game (win/lose) as well as number of guesses the user made to during the...
python question
Question 1 Write a Python program to play two games. The program should be menu driven and should use different functions to play each game. Call the file containing your program fun games.py. Your program should include the following functions: • function guess The Number which implements the number guessing game. This game is played against the computer and outputs the result of the game (win/lose) as well as number of guesses the user made to during the...
 Use basic C++
3. A text file, superstars.txt, contains statistics on cricket players. For each player, the file contains the player's first name, last name, number of matches played, total number of runs scored, number of times the player scored 100 runs in a match, and the number of wickets taken. The last row of data in the file contains the word "END" only. Some rows are shown below 30 11867 164 Chanderpaul Shivnarine 34 11912 130 Lara Brian 73...
Use basic C++
3. A text file, superstars.txt, contains statistics on cricket players. For each player, the file contains the player's first name, last name, number of matches played, total number of runs scored, number of times the player scored 100 runs in a match, and the number of wickets taken. The last row of data in the file contains the word "END" only. Some rows are shown below 30 11867 164 Chanderpaul Shivnarine 34 11912 130 Lara Brian 73...
 I literally have no idea what I’m doing. Help!!! Please show
work!!
Write an essay using Word and post it as an attachment to the discussion. Cover the following points. Choose a data set from Stat Disk using one of the following files from 13th Edition Elementary Statistics: Oscar Winner Freshman 15 Word Count Garbage Weights Passive and Active Smoke If the file contains more than one variable, choose a quantitative variable. Create a histogram using your chosen variable and...
I literally have no idea what I’m doing. Help!!! Please show
work!!
Write an essay using Word and post it as an attachment to the discussion. Cover the following points. Choose a data set from Stat Disk using one of the following files from 13th Edition Elementary Statistics: Oscar Winner Freshman 15 Word Count Garbage Weights Passive and Active Smoke If the file contains more than one variable, choose a quantitative variable. Create a histogram using your chosen variable and...
 48 57 Amy Bakery has four shops in different area in a city. Monthly sales (in thousands of dollars) from a random of 24 months from each of the 4 shops given in Table 1. Table 1: Monthly sales (in thousands of dollars) North East South West 77 75 97 60 45 42 60 54 56 49 68 47 44 39 58 57 63 61 69 51 75 63 79 50 90 81 99 73 32 47 46 41 41...
 Question 1 Use the data below to answer the questions that follow. The table below gives the approximate salaries (in millions of dollars) of the 13 members of the Los Angeles Lakers basketball team for the 2011-2012 season. Player Kobe Bryant Pau Gasol Andrew Bynum Lamar Odom Metta World Peace Luke Walton Steve Blake Salary Player 25.2 millon Derek Fisher 18.7 millon Matt Barnes 15.2 millon Troy Murphy 8.9 millon Jason Kapono 6.8 millon Derrick Caracter 5.7 millon Devin Ebanks...
 Question 6 Select one answer. Based on the results of a nation-wide study, the number of contacts programmed into cell phones are summarized on the following boxplot: 10 points 1 25 50 75 100 125 150 175 200 225 Which of the following is true about this data? A. ︵ The lowest observation is an outlier. B. O The highest observation is an outlier. C. The data is skewed left. D. O The data is skewed right. E. O There...
 Please answer all of the following.
The boxplot below shows the number of contacts in their cell by gender for my Spring 2018 statistics classes. Using the boxplot, answer the 4 questions below. Boxplot of CellNumbers 900 800 700 600 500 400 300 200 100 0 Male Female Gender CellNumbers Which distribution has 3 outliers? Which distribution appears skewed right, excluding 1. Male 1 outliers? 2. Female Which distribution is 1 3. Both less variable (has the smaller IQR)? 4....
Please answer all of the following.
The boxplot below shows the number of contacts in their cell by gender for my Spring 2018 statistics classes. Using the boxplot, answer the 4 questions below. Boxplot of CellNumbers 900 800 700 600 500 400 300 200 100 0 Male Female Gender CellNumbers Which distribution has 3 outliers? Which distribution appears skewed right, excluding 1. Male 1 outliers? 2. Female Which distribution is 1 3. Both less variable (has the smaller IQR)? 4....
 python question
Question 1 Write a Python program to play two games. The program should be menu driven and should use different functions to play each game. Call the file containing your program fun games.py. Your program should include the following functions: • function guess The Number which implements the number guessing game. This game is played against the computer and outputs the result of the game (win/lose) as well as number of guesses the user made to during the...
python question
Question 1 Write a Python program to play two games. The program should be menu driven and should use different functions to play each game. Call the file containing your program fun games.py. Your program should include the following functions: • function guess The Number which implements the number guessing game. This game is played against the computer and outputs the result of the game (win/lose) as well as number of guesses the user made to during the...
Most questions answered within 3 hours.
-
Where is the error in this code sequence?
String s1 = "Hello";
String s2 = "ello";...
asked 10 months ago -
Financial data for Joel de Paris, Inc., for last year
follow:
Joel de Paris, Inc.
Balance...
asked 10 months ago -
Consider this reaction:
Al2(SO4)3 (aq)+ BaCl3
(aq) Al2Cl6 (aq)- +
3BaSO4(s) . What is the...
asked 10 months ago -
Suppose that Savneet is considering increasing her
recent random sample from 20 car rentals to 40...
asked 10 months ago -
Trucks arrive at an unloading terminal at an average rate of 120
per hour.
Trucks arrive...
asked 10 months ago -
Why are methanol and ethanol completely soluble in water while
octanol is not very little soluble....
asked 10 months ago -
A facilities manager at a university reads in a research report
that the mean amount of...
asked 10 months ago -
When the CuSO4 is rehydrated by adding water to the anhydrous
compound, is this an endothermic...
asked 10 months ago -
A ray of sunlight is passing from diamond into crown glass; the
angle of incidence is...
asked 10 months ago -
A block of mass 0.249 kg is placed on top of a light, vertical
spring of...
asked 10 months ago -
how do the kidneys compensate in the presences of acidosis
a) trigger hyperventilate
b) reserve acid...
asked 10 months ago -
Question 501 pts
The rental rate of capital to the firm increases. Which of the
following...
asked 10 months ago