
Homework Answers
Add Answer to:
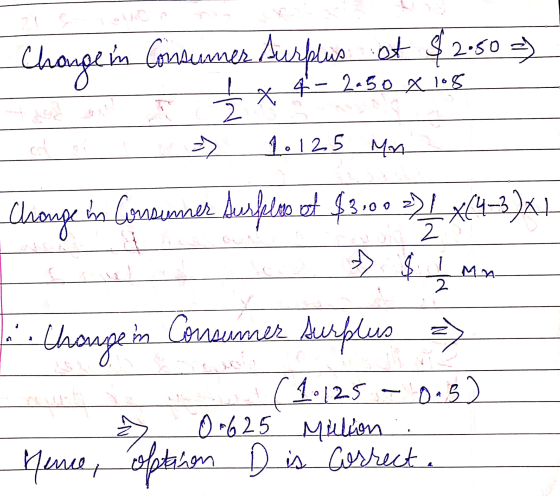
In the graph of the soft drink market shown here, the original equilibrium price is $2.50...
0 - ZOOM + L M L MARKET EQUILIBRIUM & POLICY IN-CLASS WORKSHEET 5 This question...
 0 - ZOOM + L M L MARKET EQUILIBRIUM & POLICY IN-CLASS WORKSHEET 5 This question examines the market for energy drinks. You will use the quantity demanded and the quantity supplied at different prices to identify the equilibrium price and to examine what happens when the government imposes a price floor in the market for energy drinks. Below, you are provided with the quantity of energy drinks demanded and supplied. This data is obtained from points on the demand...
6.00 5.507 5.00 4.50 4.00 3.50 Price floor Price 3.00 2.50 2.00- 1.50- 1.00- 0.504 6...
 6.00 5.507 5.00 4.50 4.00 3.50 Price floor Price 3.00 2.50 2.00- 1.50- 1.00- 0.504 6 5 10 15 20 25 30 35 40 45 50 55 Quantity (in thousands) The diagram to the right shows a market in which a price floor of $3.00 per unit has been imposed. With the price floor, consumer surplus is $ (enter a numeric response using an integer), producer surplus is $ deadweight loss is $ and surplus transferred from consumers to producers...
1. Suppose the price of a taco is $1 and the price of a soft drink...
 1. Suppose the price of a taco is $1 and the price of a soft drink is $2. If Mehmet has $5, then he can buy: A) four tacos and two soft drinks B) three tacos and two soft drinks C) four tacos and one soft drink D) three tacos and one soft drink 2. Tena has $50 per week to spend on lunches. Egg rolls cost $2 each and a plate of chow mein costs $7. Tena wants to...
The following graph shows the daily market for wine when a tax on sellers is set...
 The following graph shows the daily market for wine when a tax on sellers is set at $0 per bottle. Suppose the government institutes a tax of $40.60 per bottle, to be paid by the seller. (Hint: To see the impact of the tax, enter the value of the tax in the Tax on Sellers field and move the green line to the after-tax equilibrium by adjusting the value in the Quantity field. Then enter zero in the Tax on...
Consider the market for gasoline, illustrated in the figure to the right. Suppose the government adds...
 Consider the market for gasoline, illustrated in the figure to
the right. Suppose the government adds a $1.50 per gallon excise
tax on gasoline, which shifts the supply curve from S1 to S2 , as
illustrated. What is tax incidence? Consumers pay $------- of the
tax and producers pay $------ of the tax. (Enter your responses
rounded to two decimal places.)
Question Help on 5.50 S2 5.00-1 4.50 4.00- G 3.50- 3.00 Price (dollars per gallon) 2.50 2.00 1.50 1.00...
Consider the market for gasoline, illustrated in the figure to
the right. Suppose the government adds a $1.50 per gallon excise
tax on gasoline, which shifts the supply curve from S1 to S2 , as
illustrated. What is tax incidence? Consumers pay $------- of the
tax and producers pay $------ of the tax. (Enter your responses
rounded to two decimal places.)
Question Help on 5.50 S2 5.00-1 4.50 4.00- G 3.50- 3.00 Price (dollars per gallon) 2.50 2.00 1.50 1.00...
We are at the market for wine. Graph original demand, supply, equilibrium price and quantity for...
We are at the market for wine. Graph original demand, supply, equilibrium price and quantity for each one. Then, show shifts on new equilibrium price, quantity, supply, and demand. Show changes and explain. a) Wine breweries close because of changes in laws for alcohol. b) Price for alcoholic cider decreases, and price of grapes (wine ingredient) increases. c) New wine filling machine is invented that is cheaper and more efficient. The popularity of crafting wine rises. d) Government puts 9%...
2. Taxes and welfare Consider the market for designer purses. The following graph shows the demand...
 2. Taxes and welfare Consider the market for designer purses. The following graph shows the demand and supply for designer purses before the government imposes any taxes. First, use the black point (plus symbol) to indicate the equilibrium price and quantity of designer purses in the absence of a tax. Then use the green point (triangle symbol) to shade the area representing total consumer surplus (CS) at the equilibrium price. Next, use the purple point (diamond symbol) to shade the...
Graph Input Tool Market for Wine 60 Price (Dollars per bottle) 54 Supp 12.00 48 Quantit...
 Graph Input Tool Market for Wine 60 Price (Dollars per bottle) 54 Supp 12.00 48 Quantit Demanded 48 Quantity Supplied ttles) Shortage ttles) 12 (Thousands of E42 D 38 30 24 O 18 usands of ttles) Surplus ttles) 36 Thousands of usands of cr and Demand Shifter Supply Shifter Price of Champagne (Dollars per bottle) Price of Grapes (Dollars per pound) 50.00 6.00 0 12 18 24 30 38 42 48 54 60 QUANTITY (Thousands of bottles of wine) Reset...
Consider the market for luxury yachts depicted on the following graph. Determine the equilibrium price and...
 Consider the market for luxury yachts depicted on the following graph. Determine the equilibrium price and quantity of luxury yachts in the absence of a tax. Using the green triangle (triangle symbols), shade the area representing total consumer surplus (CS) at the equilibrium price. Next, use the purple triangle (diamond symbols) to shade the area on the following graph representing total producer surplus (PS) at the equilibrium price. PRICE (Thousands of dollars per yacht! Supply 0 10 20 Demand 30...
Suppose that Coca-Cola decides introduce a new diet soft drink in the market. The product is...
 Suppose that Coca-Cola decides introduce a new diet soft drink in the market. The product is expected to sell well but it will lkely reduce the sales of some of their other products. Analysts expect that the other diet drinks that Coke sells wil lose $20.00 million in sales per year. The ater-tax operating maran on sales for Coke is 29.00% what 6 the yearty side effect for inoducing the new product? (Expess as posiäive number and answer in terms...
 0 - ZOOM + L M L MARKET EQUILIBRIUM & POLICY IN-CLASS WORKSHEET 5 This question examines the market for energy drinks. You will use the quantity demanded and the quantity supplied at different prices to identify the equilibrium price and to examine what happens when the government imposes a price floor in the market for energy drinks. Below, you are provided with the quantity of energy drinks demanded and supplied. This data is obtained from points on the demand...
 6.00 5.507 5.00 4.50 4.00 3.50 Price floor Price 3.00 2.50 2.00- 1.50- 1.00- 0.504 6 5 10 15 20 25 30 35 40 45 50 55 Quantity (in thousands) The diagram to the right shows a market in which a price floor of $3.00 per unit has been imposed. With the price floor, consumer surplus is $ (enter a numeric response using an integer), producer surplus is $ deadweight loss is $ and surplus transferred from consumers to producers...
 1. Suppose the price of a taco is $1 and the price of a soft drink is $2. If Mehmet has $5, then he can buy: A) four tacos and two soft drinks B) three tacos and two soft drinks C) four tacos and one soft drink D) three tacos and one soft drink 2. Tena has $50 per week to spend on lunches. Egg rolls cost $2 each and a plate of chow mein costs $7. Tena wants to...
 The following graph shows the daily market for wine when a tax on sellers is set at $0 per bottle. Suppose the government institutes a tax of $40.60 per bottle, to be paid by the seller. (Hint: To see the impact of the tax, enter the value of the tax in the Tax on Sellers field and move the green line to the after-tax equilibrium by adjusting the value in the Quantity field. Then enter zero in the Tax on...
 Consider the market for gasoline, illustrated in the figure to
the right. Suppose the government adds a $1.50 per gallon excise
tax on gasoline, which shifts the supply curve from S1 to S2 , as
illustrated. What is tax incidence? Consumers pay $------- of the
tax and producers pay $------ of the tax. (Enter your responses
rounded to two decimal places.)
Question Help on 5.50 S2 5.00-1 4.50 4.00- G 3.50- 3.00 Price (dollars per gallon) 2.50 2.00 1.50 1.00...
Consider the market for gasoline, illustrated in the figure to
the right. Suppose the government adds a $1.50 per gallon excise
tax on gasoline, which shifts the supply curve from S1 to S2 , as
illustrated. What is tax incidence? Consumers pay $------- of the
tax and producers pay $------ of the tax. (Enter your responses
rounded to two decimal places.)
Question Help on 5.50 S2 5.00-1 4.50 4.00- G 3.50- 3.00 Price (dollars per gallon) 2.50 2.00 1.50 1.00...
 2. Taxes and welfare Consider the market for designer purses. The following graph shows the demand and supply for designer purses before the government imposes any taxes. First, use the black point (plus symbol) to indicate the equilibrium price and quantity of designer purses in the absence of a tax. Then use the green point (triangle symbol) to shade the area representing total consumer surplus (CS) at the equilibrium price. Next, use the purple point (diamond symbol) to shade the...
 Graph Input Tool Market for Wine 60 Price (Dollars per bottle) 54 Supp 12.00 48 Quantit Demanded 48 Quantity Supplied ttles) Shortage ttles) 12 (Thousands of E42 D 38 30 24 O 18 usands of ttles) Surplus ttles) 36 Thousands of usands of cr and Demand Shifter Supply Shifter Price of Champagne (Dollars per bottle) Price of Grapes (Dollars per pound) 50.00 6.00 0 12 18 24 30 38 42 48 54 60 QUANTITY (Thousands of bottles of wine) Reset...
 Consider the market for luxury yachts depicted on the following graph. Determine the equilibrium price and quantity of luxury yachts in the absence of a tax. Using the green triangle (triangle symbols), shade the area representing total consumer surplus (CS) at the equilibrium price. Next, use the purple triangle (diamond symbols) to shade the area on the following graph representing total producer surplus (PS) at the equilibrium price. PRICE (Thousands of dollars per yacht! Supply 0 10 20 Demand 30...
 Suppose that Coca-Cola decides introduce a new diet soft drink in the market. The product is expected to sell well but it will lkely reduce the sales of some of their other products. Analysts expect that the other diet drinks that Coke sells wil lose $20.00 million in sales per year. The ater-tax operating maran on sales for Coke is 29.00% what 6 the yearty side effect for inoducing the new product? (Expess as posiäive number and answer in terms...
Most questions answered within 3 hours.
-
Where is the error in this code sequence?
String s1 = "Hello";
String s2 = "ello";...
asked 11 months ago -
Financial data for Joel de Paris, Inc., for last year
follow:
Joel de Paris, Inc.
Balance...
asked 11 months ago -
Consider this reaction:
Al2(SO4)3 (aq)+ BaCl3
(aq) Al2Cl6 (aq)- +
3BaSO4(s) . What is the...
asked 11 months ago -
Suppose that Savneet is considering increasing her
recent random sample from 20 car rentals to 40...
asked 11 months ago -
Trucks arrive at an unloading terminal at an average rate of 120
per hour.
Trucks arrive...
asked 11 months ago -
Why are methanol and ethanol completely soluble in water while
octanol is not very little soluble....
asked 11 months ago -
A facilities manager at a university reads in a research report
that the mean amount of...
asked 11 months ago -
When the CuSO4 is rehydrated by adding water to the anhydrous
compound, is this an endothermic...
asked 11 months ago -
A ray of sunlight is passing from diamond into crown glass; the
angle of incidence is...
asked 11 months ago -
A block of mass 0.249 kg is placed on top of a light, vertical
spring of...
asked 11 months ago -
how do the kidneys compensate in the presences of acidosis
a) trigger hyperventilate
b) reserve acid...
asked 11 months ago -
Question 501 pts
The rental rate of capital to the firm increases. Which of the
following...
asked 11 months ago